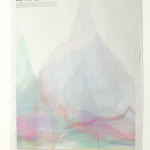
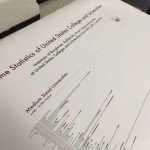
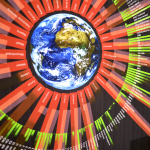
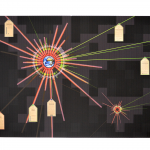
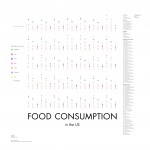
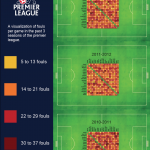
Working with large data sets by hand is time consuming, tedious, and error prone. Using data processing applications and custom code can make working with this kind of data much easier. In addition, these tools afford a level of experimentation and exploration that working by hand does not. Start this assignment by sourcing, collecting, or generating an interesting and large data set. Create a rich visualization of this data that separately represents at least 1000 pieces of data. This is enough data that working manually is impractical, but small enough to be easily handled by (even very inefficient) computer programs.
September 29 - Kickoff
October 6 - Discovery/Proposal Due
October 13 - Proof of Concepts Due
October 20 - Work Day
October 27 - Project Crit
November 3 - Project Documentation Due
Choosing a Data Set
The data you work with is up to you. By today’s standards you don’t need that much, but you do need at least 1000 separate pieces of data. A list of U.S. state populations counts as 50 pieces of data, even though they add up to about 314 million people. The annual state populations for the past 50 years would be more than enough.
You can use existing data provided by a third party. For example the U.S. government provides a lot of data. The FBI knows how many murders involve arson, spouses, and/or bare hands(XLS). The USDA can tell you if baked fish have more calories than Lucky Charms(XML). Also, be sure to look through the research assignment posts for more sources. Better yet, start with what you want to make work about and find out what related data is available.
- [http://research.stlouisfed.org/fred2/]
- [http://populationlabs.com/]
- [http://vincentarelbundock.github.io/Rdatasets/]
- [http://www.informationisbeautiful.net/2012/hollywood-budgets-a-data-viz-challenge/]
Alternatively, you can collect or generate your own data. Create a Google survey and get 1000 people to fill it out. Or get 100 people to tell you 10 things. Or get one person to tell you 1000 things. Use a Fitbit, Nike FuelBand, or a smart-phone App to track your daily activity. Use the server logs from your website. Use meta-data from your photo collection. Make a program that spiders a website. Count the frequency of names in the Bible or GOT by chapter. Count something. Measure something.
Visualizing the Data
What about your data is interesting? What do you want to show? Why? First figure out the intent of your communication, then design a visualization in service of that intent. The type of visualization is open. You may use any type of chart, graph, or map. You can stick to conventional types of displays or design your own.
The choice of tools is open, you will probably use Processing in combination with other tools. Consider the following:
- The nature and format of your data
- The type of visualization you want to create
- Integration with Illustrator or other software for creating the final poster
- Your experience and skill
- Your learning objectives
Designing the Poster
You are making a poster. “Poster” is a pretty broad term, but here are some guidelines. Your work will be printed on paper. It should be large enough to draw attention and to clearly show its data. It should stand on its own, expressing a complete thought. Your visualization should be the most important element on the poster, but it does not have to stand alone. You may, you should, support your visualization with additional text and graphics. Include a title, provide a short explanation, and cite your sources.
The code you use to build your visualization doesn’t have to do everything. Rather, consider it as part of your work flow.
Constraints
- Your final product will be a printed poster (Around A1 Size).
It’s printed, so animation, interactivity and depth are out. The large, printed format offers much more resolution than your screen. Take advantage of that. - You need to separately represent at least 1000 pieces of data.
If you show 1000 people’s birth months in a pie chart, you are showing 12 pieces of data. If you plot their births on a time-line, you are showing 1000.
Discovery/Proposal
Your discovery and proposal is due next week. This is much more than thinking up an idea. The effort you put in over the next week in planning your project will be critical to the success of your project. Your real assignment for this week is to develop a clear, achievable goal and complete plan to achieve it. The proposal is written communication of this effort. If you need to change your goal next week, you didn’t succeed at this weeks goal.
Developing an Idea
You should begin with a few general topics, some of these may not pan out. For each topics, do some basic background research. Hit up Wikipedia and get some context and history on the topic. Look for available data sources. Think about what you want to say or show. Narrow down to the most viable topic. Do some deeper research. Look closely at the available data to make sure it is usable. Make absolutely sure you can download, open, and view the raw data you want to use. Decide what data you will visualize, and how you will display it. Boil your message down to one sentence that can be supported by your visualization. You now have an idea.
Designing a Comp
In commercial design, Comprehensive Layouts (comps) are important communication tools. The intent of the comp is to show how the finished piece will look, before final content is available. A comp is much more than a sketch or wire-frame. It will show the layout, type, and color choices. This comp will include a draft of your visualization (probably hand made with a small set of dummy data). Though you will likely make changes over the course of this project, you should be designing your poster this week.
By next week, post your proposal to the blog. Include (at least):
- The subject of your poster.
Whether your poster promotes, persuades, or informs, it will be about something. Start by telling me the purpose of your poster, and why you are pursuing this poster. Continue by providing background and context on your topic. Assume your reader is uninformed about your topic. Include links. (100-200 words)
- The data you will use.
Show that the data you need is available. Explain where your data you will get your data (or how you will generate it). Describe the detail and breadth of the data set. Who collected it? Why did they publish it? What information did they collect? How much data is there? What specific part of the data will be helpful to you? Include Links. (100 words)
- The tools and approach you will use.
Show that you have a clear, complete plan. What tools will you use to create the visualization and design the poster? Do you have access to the tools? What will the main steps in production be? Are there any challenges you are unsure about? How will you address them? Where will you print it? Include links (100-200 words)
- Your design comp
Include your image in the post itself and link to a .pdf so we can get a closer look. Also bring a print of your comp for discussion. Your print does not need to be full size, but should be large enough to read clearly. You may tile your print.
This proposal (content and presentation) will be graded separately from the full project. Take the time to design your blog post. Consider including images to support your text. Review your spelling and grammar and have someone else proof it as well.
Building Technical Proofs of Concept (POCs)
One good test is worth a thousand expert opinions.
― Wernher von Braun
Even relatively simple programs often contain multiple parts. Understanding these programs requires not only understanding each part, but how they interact. It is often best to avoid the complexities of interactions by minimizing interactions so you can focus on developing a specific feature in isolation. Once the feature is understood and working well, integrating it into the complete program is much easier.
A good way to start many programming projects is to list the key features, note which features will be new challenges, and to create small programs that focus on each of those challenges, one at a time. These small programs are sometimes called Proofs of Concept. Building a Proof of Concept is one of the best ways to make sure that a particular aspect of your project is feasible. In addition, POCs provide you with a valuable code example you can reference when building your full project. Your POCs should be as short, clear, and focused as possible; make code that does one thing completely and well.
For next week create Proofs of Concept that demonstrate that you can implement every significant technical aspect of your visualization. Begin by listing the important steps your program will need to complete to generate your visualization. Once you have your list, create POCs for the relevant items on your list. Create a blog post that contains your list and zip files of your POC sketches. For POCs that have visual output include images.
Document Your Work
Document this poster now.
Make a habit of documenting every project as soon as its done (and document big projects as you do them). Even ones you don’t like much. Seriously.
In time your projects will get damaged, lost, and forgotten. It will be harder to write about projects as they grow stale in your mind. The work you’ll need to shoot will pile up. You’ll suddenly need to pull together a portfolio and you won’t have time. Your portfolio is the single most important tool you have for showing potential employers and collaborators what you can do. If it isn’t in your portfolio you basically didn’t do it—pics or it didn’t happen.
Don’t put every project in your public portfolio, but keep every project in your private one.
For this project you should take a few high quality photographs. Get a real camera, get some lights, find a good place. Take a boring straight on shot. Take a detail or two. Take some shots that show the poster in an interesting location. Shoot one with people. Shoot so you can see the texture in the paper. A .pdf shows what your design looked like, a photo shows what your actual poster looked like. Don’t take a hundred shots. Plan, set-up, and take 10, edit down to 5.
Write a description of your project and poster. I’ll leave the outline of the writing to you. Provide background the topic of the poster. Explain the value of your poster. Describe how you made it.
Post to the blog:
- 5+ high quality photos of your poster
- 1 high res .pdf of your poster
- 200 word project description
Interesting