The Arab Spring Revisted
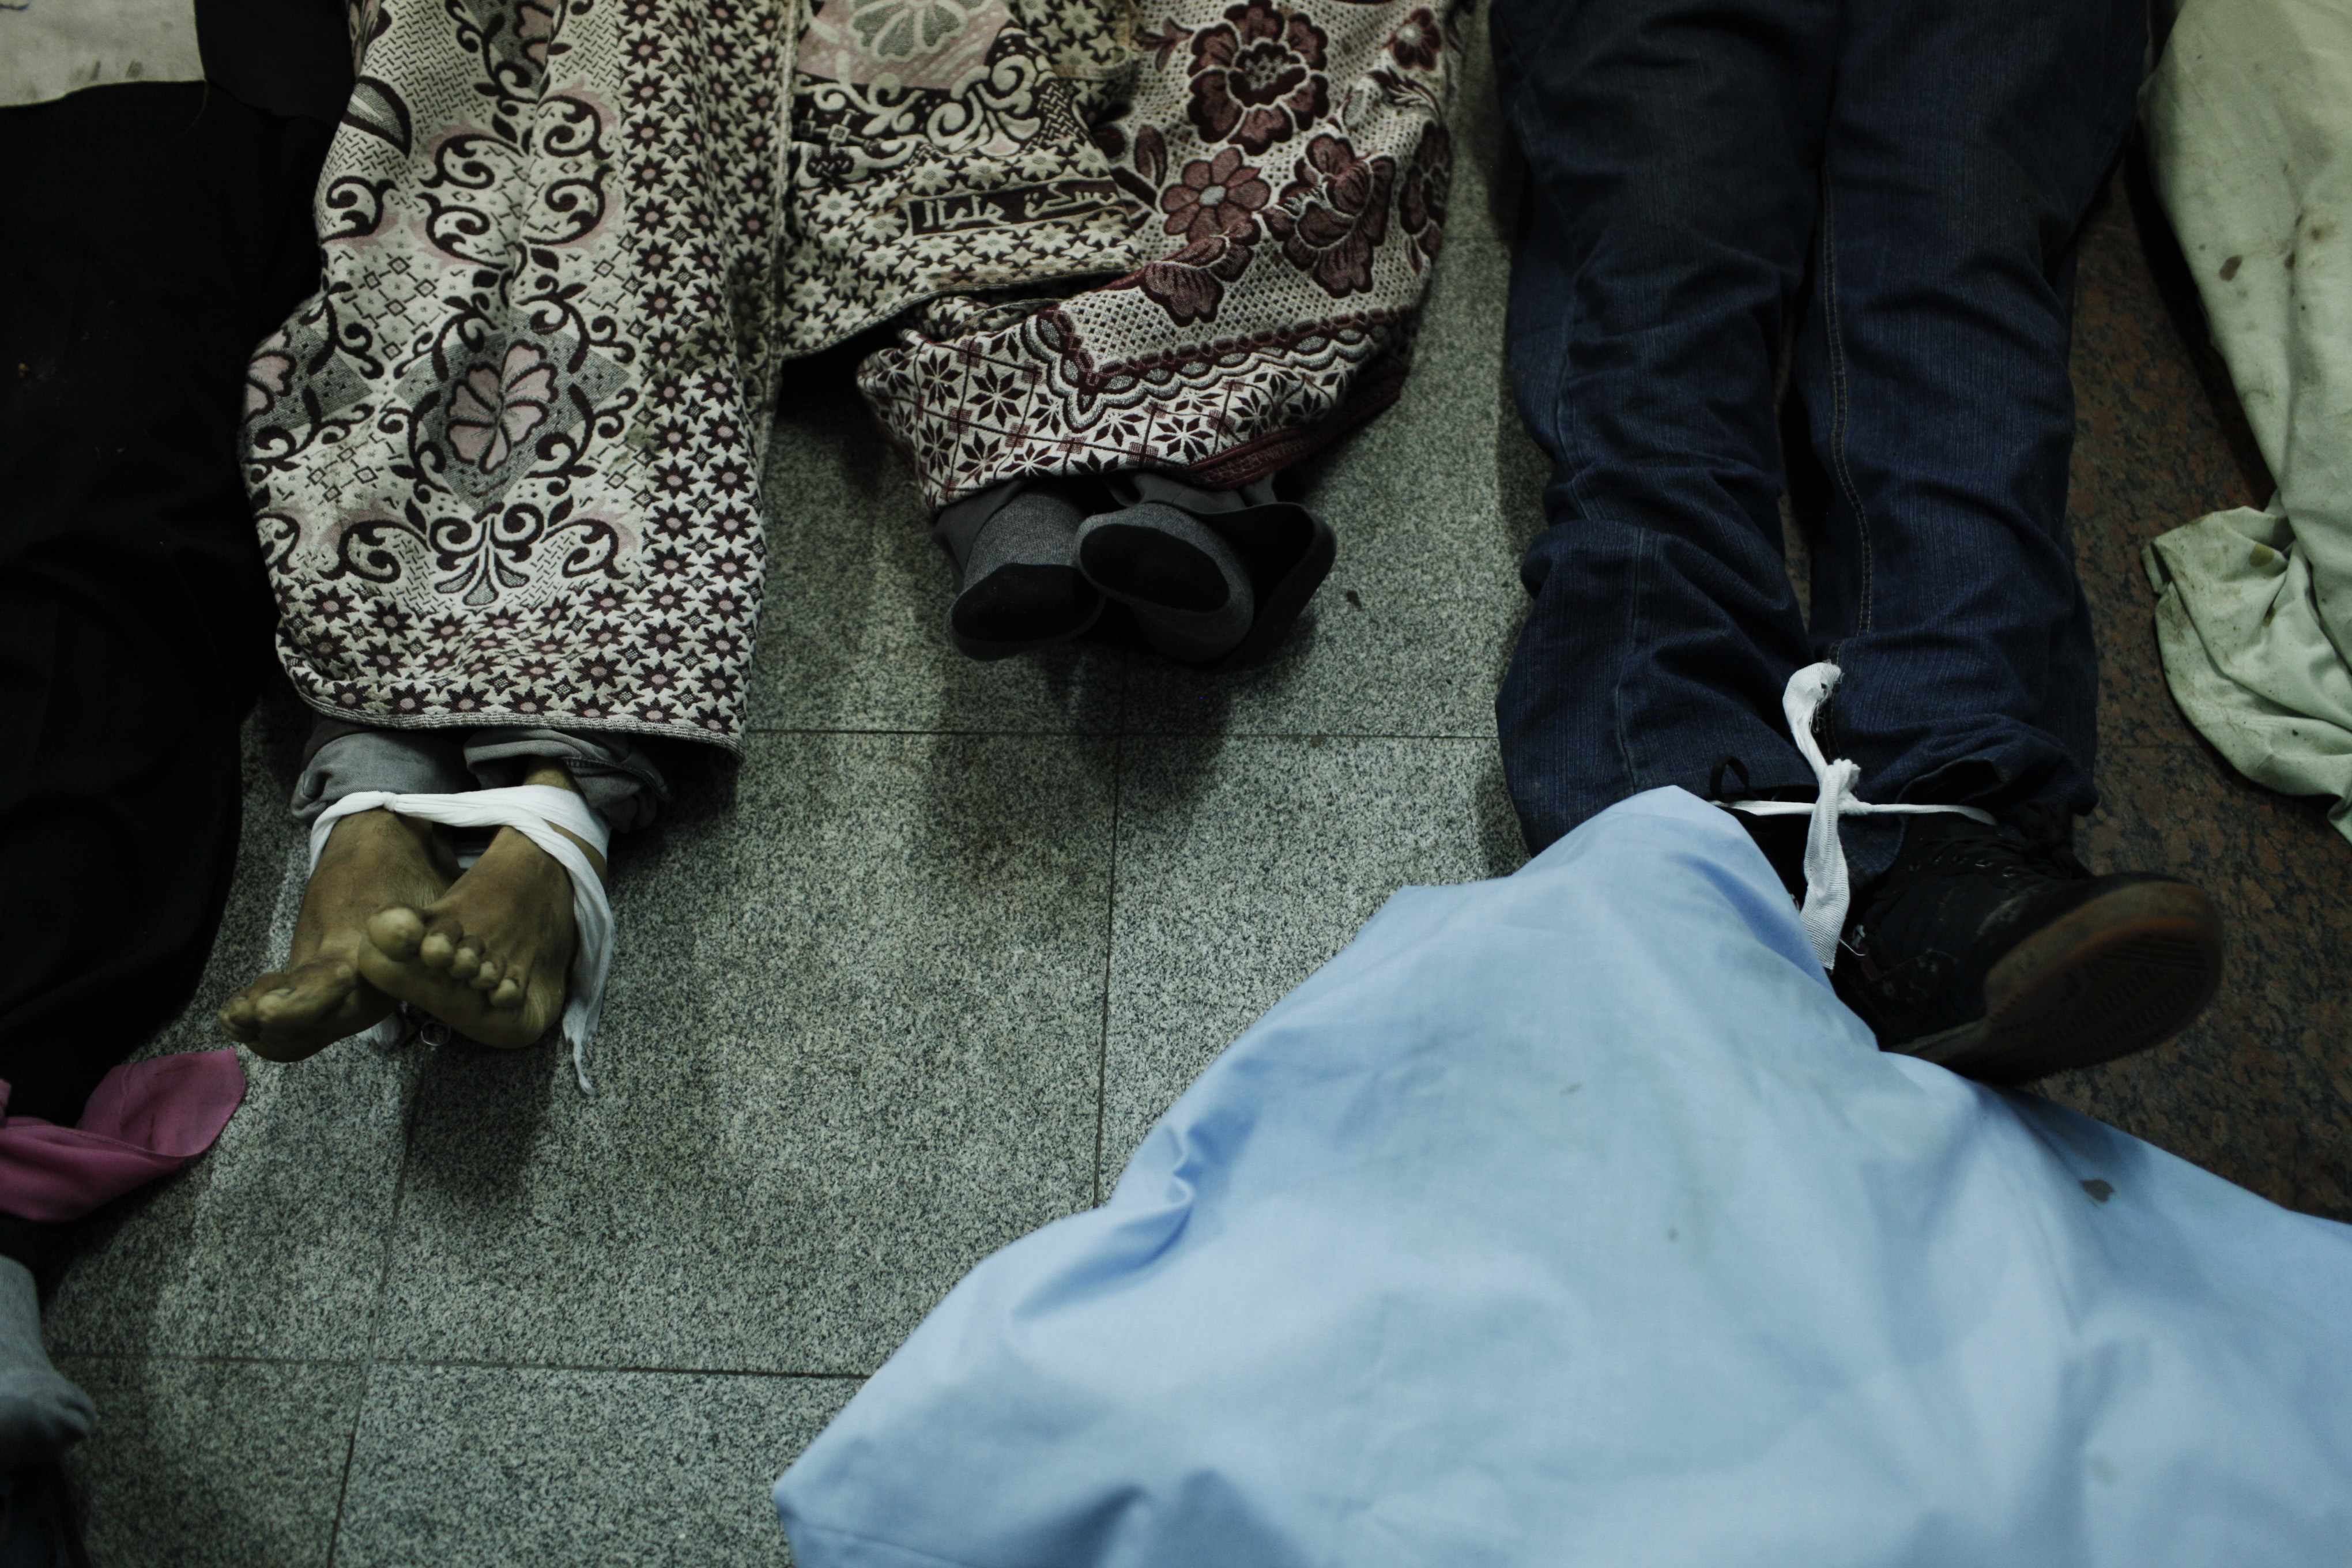
On January 25, 2011 Egyptians took to the streets to protest peacefully against President Hosni Mubarak, calling for social justice and democracy – sparked by the death of a 27-year old man from Alexandria at the hands of the Egyptian police. On February 11, Mubarak resigned. Over the following three years the country went down a bumpy road resulting in more than 4000 casualties.
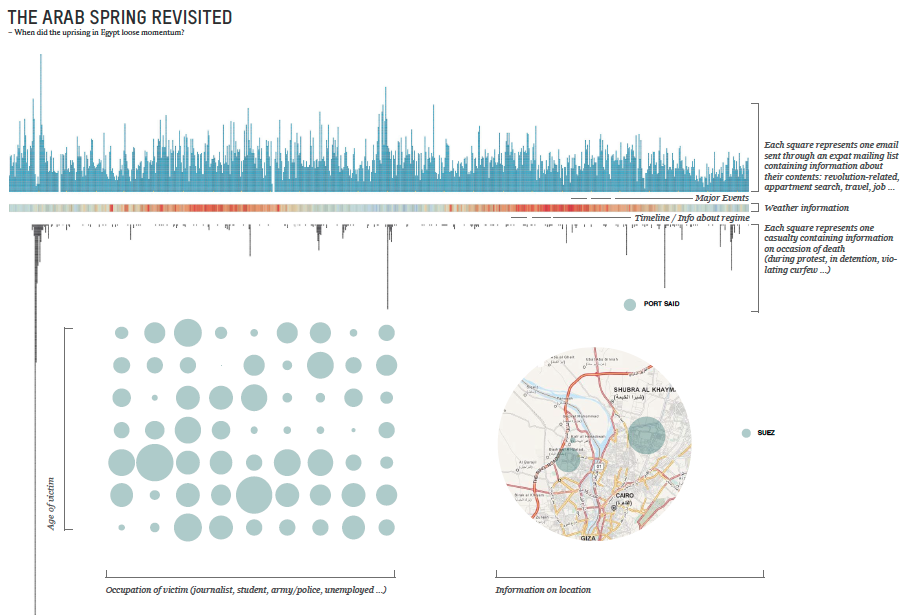
The key question that is guiding this visualisation is: When did the uprising in Egypt loose momentum? By confronting casualties during this popular unrest in Egypt with corresponding weather conditions and the number of messages sent through CairoScholars, a mailing list that serves expat students and scholars, the visualisation will investigate that matter.

The Data
WikiThawra is a database compiled by a non-profit cooperative, which contains data about of every single person that died since the outbreak of protests in January 2011.
It provides information on day, place, occasion of death, name, age and occupation. The reason of publishing this continuing database is to keep track of incidents happening at fast pace and to remember … This database will be the main source for the visualization. The weather data is provided by an online archive. The data on messages exchanged during the time I have access to through a listserve hosted by UT Texas.
Casualties: http://wikithawra.wordpress.com/casualities/
Messages: https://utlists.utexas.edu/sympa/info/cairoscholars
Weather: http://www.wunderground.com/history/
Approach/Tools
The first and most time-consuming step is going to be to sort and clean the data. Once the the data set is fixed I will use Processing and Illustrator to visualise the data.
Comp
my proposal: