Asthma Environmental Factors and Pollutants that contribute to the disease
The What & The Who:
When thinking of this project I knew I wanted to research data on environmental air pollutants and their affects on Asthma patients. When reviewing the data provided by the CDC and the EPA I couldn’t help but notice a common theme in the higher rates of asthmatics in urban communities.
The Why:
This theme promoted me to research this topic further . Through this data analyses I’d like to take the tables from both the CDC and the EPA to find the most common air pollutant factors that contribute to asthma and see why the disease has increases in the last ten years. These consequences have been seen in many recent weather related disaster where the people most affected by these incidents are the poor and people of color in urban communities particular the children. Opportunities in these areas are far and few but the right to breathe clean air is the right of every human life and these supposed “act” and “laws” should have tougher enforcement rules.
The How:
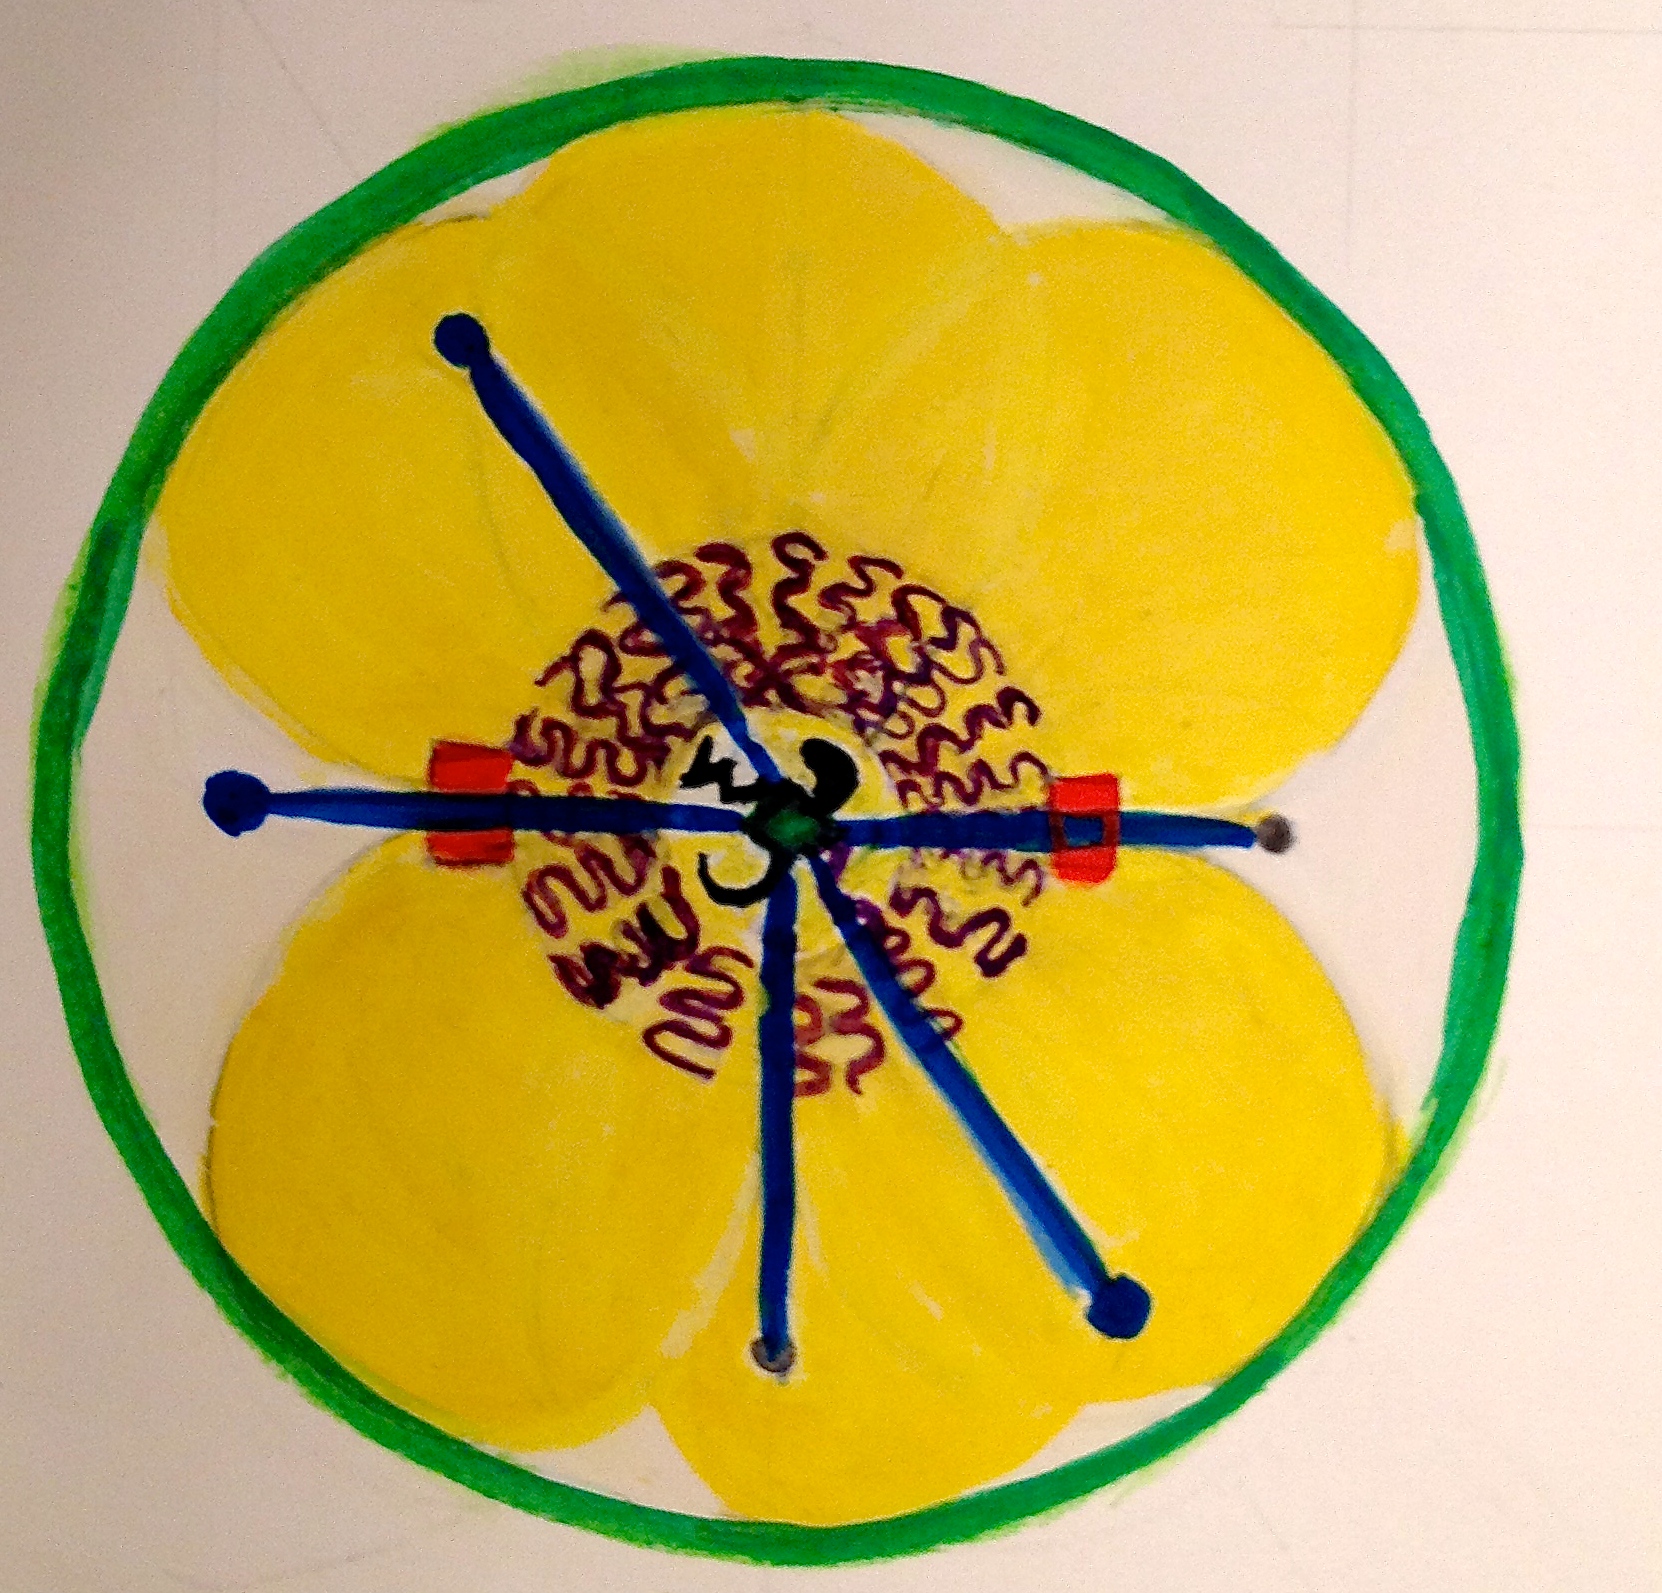
By creating an info-graphic poster that will hopefully impact the viewer to the data provided along with a powerful graphic image that will help to disturb it’s audience. I will start analyzing the process by following a basic formula which hopefully will bring me some more insight on the data. I ‘ll cross referencing Asthma by States (10 worst states for asthma) then by age group (ages 0-10) and by the types of air pollutants that are contributing factors to the disease.
Informations Sources:
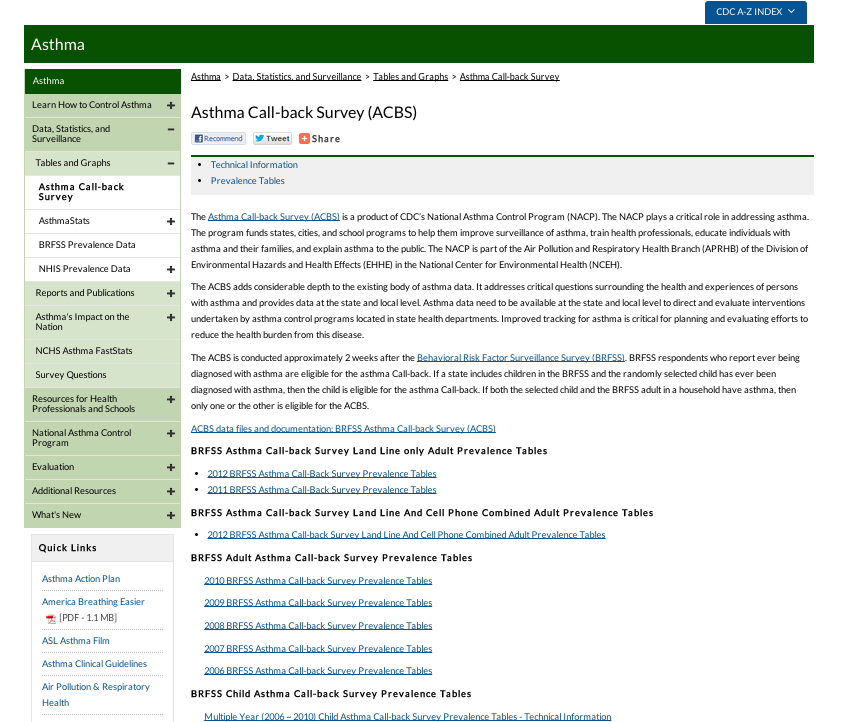
The following is a list of pollutants being monitored by the EPA and which they have provided CSV data files.
CO2 emissions
Lead
Ozone
NO2
PM10
PM2.5 (particle matter)
SO2
PM2.5 Chemical Speciation Network
“Trends Speciation” and “Supplemental Speciation” monitors only
NATTA (National Air Toxic Trend Station)
NCore (Multi-pollutant Monitoring Network)
This is an interactive Map on Air data provided by the EPA and Google which provides CSV data on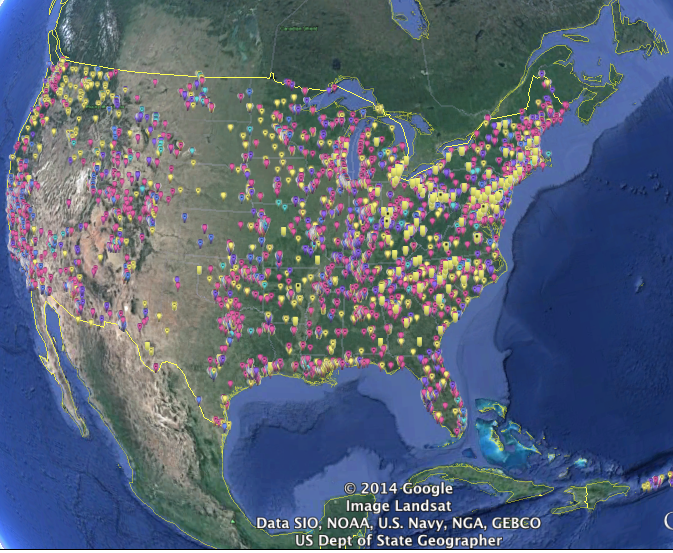
This is a closeup of the North East air quality.
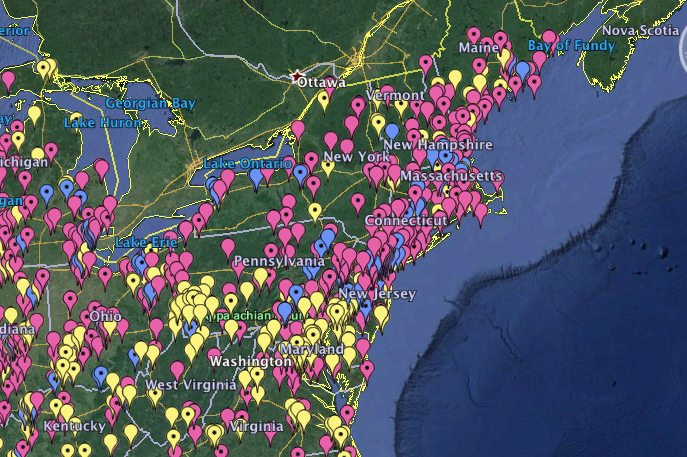
The pink is representational of the Ozone
The blue is representational of Carbon
The yellow id representational of Lead
Asthma and Allergy Foundation of America