Data Visualization Aggregator
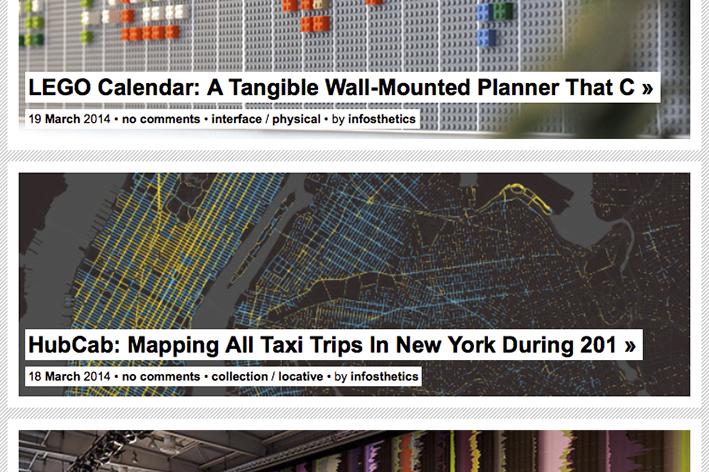
A blog featuring projects that represent data or information in
original or intriguing ways. It is designed and maintained by
Andrew Vande Moere, an Associate Professor at KU Leuven
University, Belgium.
http://infosthetics.com
A visualization
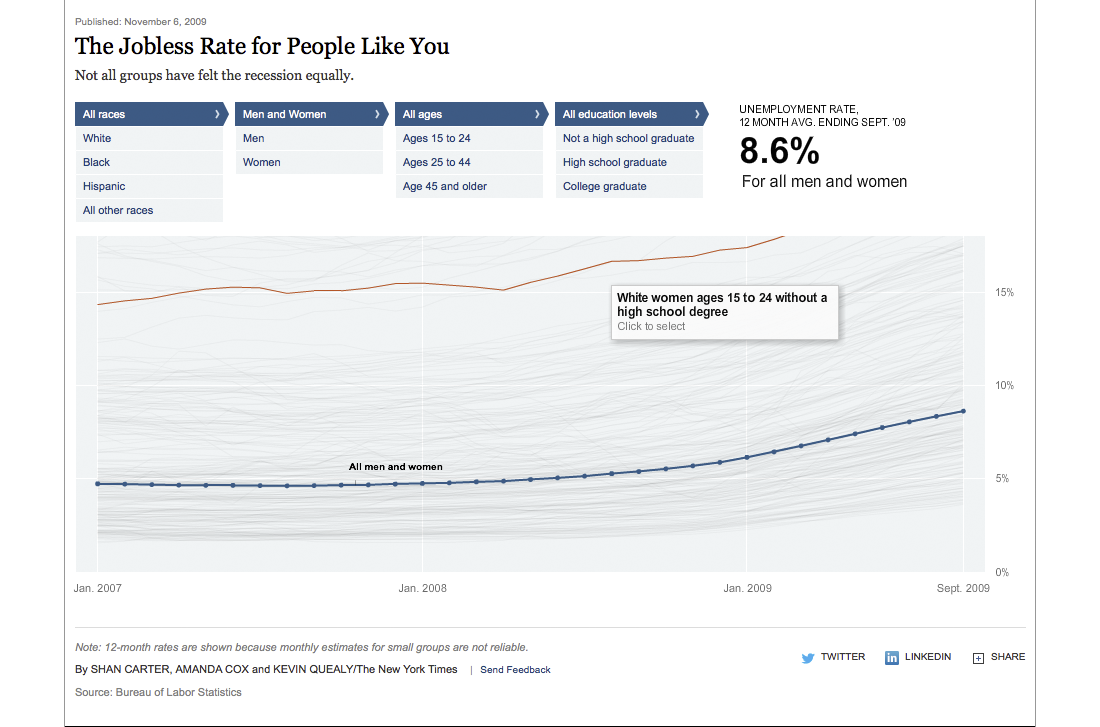
An interactive data visualization that shows various demographics (race, age, gender, education) and the corresponding unemployment rates in the US during the months following the recession in 2007/8. It makes you want to explore …
http://www.nytimes.com/interactive/2009/11/06/business/economy/unemployment-lines.html
Artist/Designer
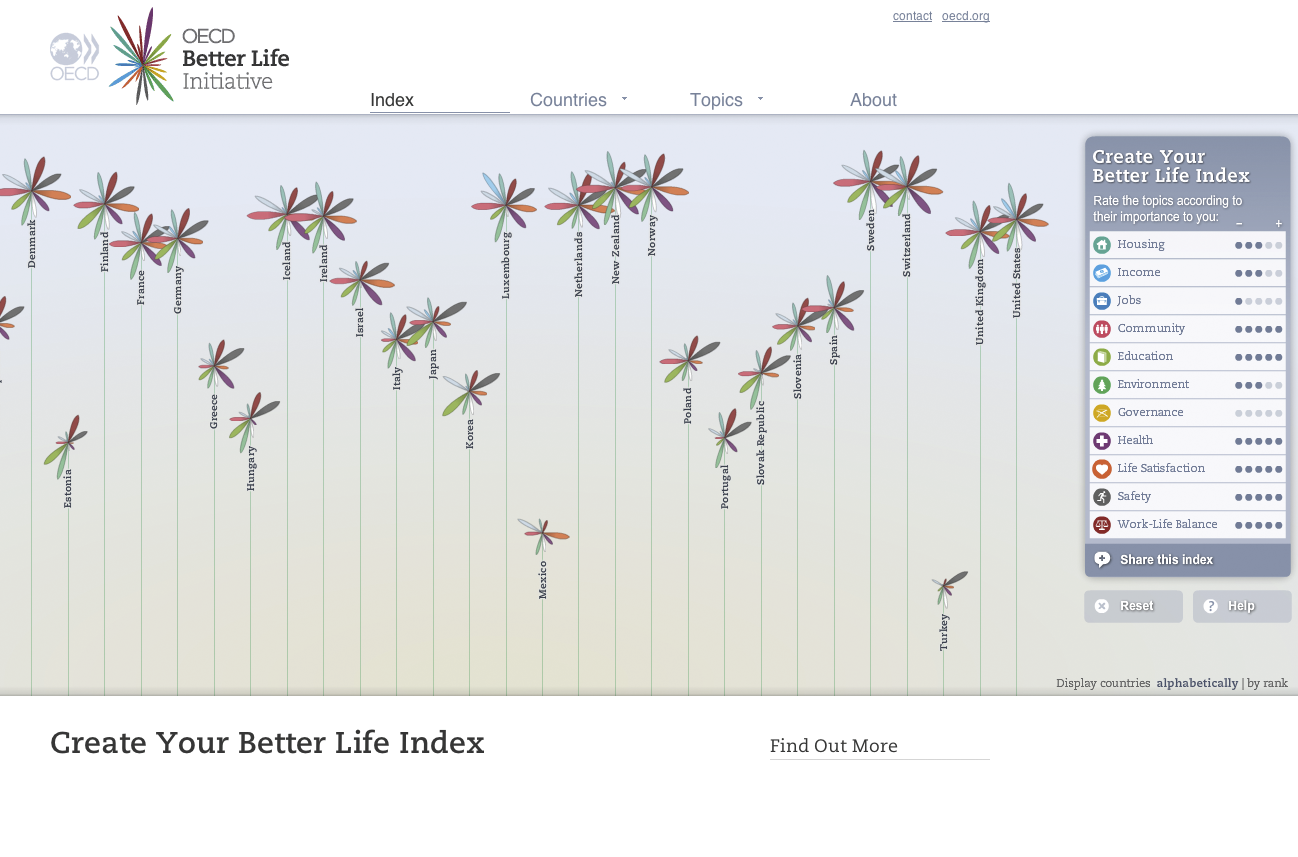
Information visualizer from Germany who calls himself Truth & Beauty Operator. With a background in Cognitive Science (B.Sc.) and
Interface Design (M.A.) he created an extensive body of work during recent years with clients like OECD, dpa, Skype, FIFA.
http://moritz.stefaner.eu
Visualization Tool
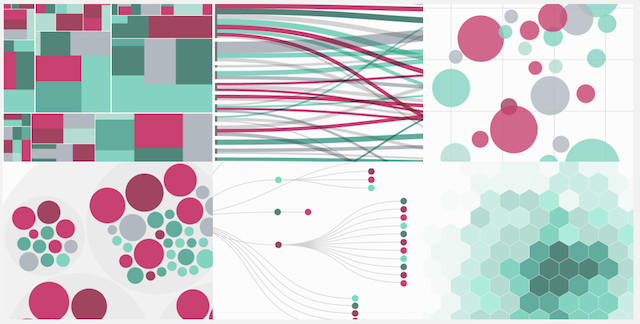
A link between spreadsheets and vector graphics. This handy
online tool allows to upload data, explore it and export the visualization in vector format (SVG) which you then can edit with e.g. Adobe Illustrator …
http://raw.densitydesign.org
Data Collection Tool
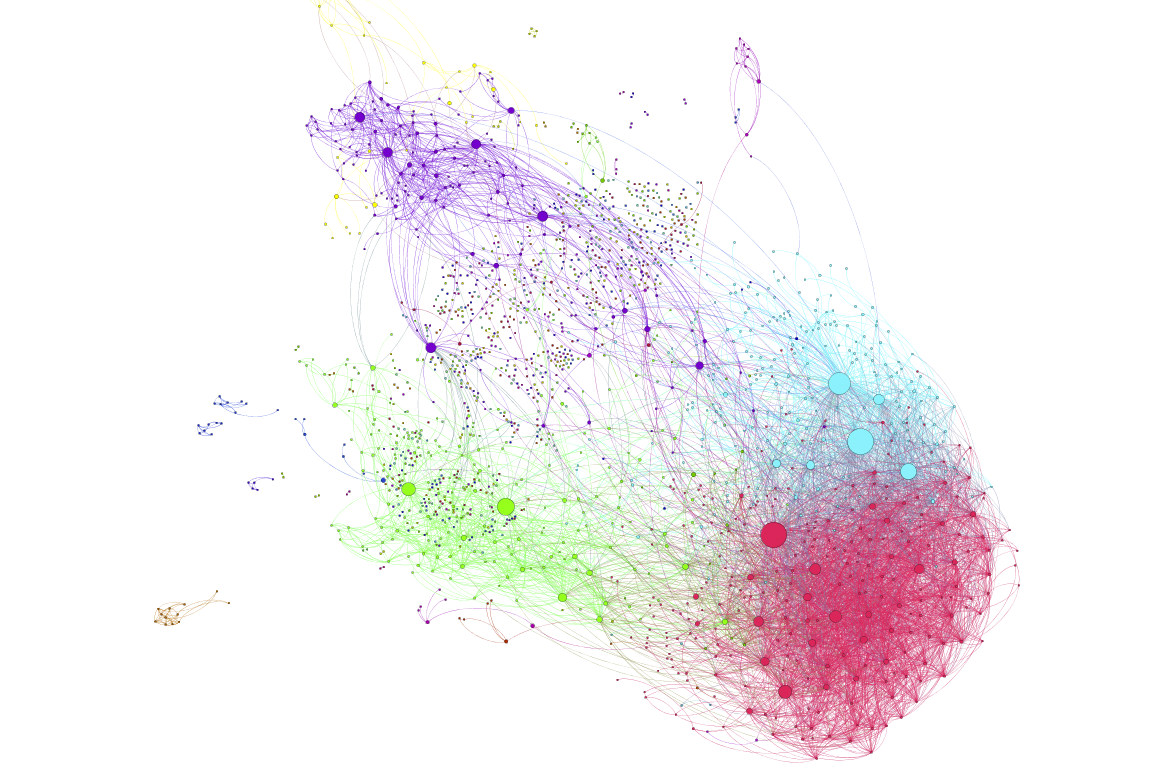
Network visualization of Facebook data done with Gephi, a network analysis and visualization tool. The data can be extracted using Netvizz, a data collection and extraction application.
Book

It is not the most up-to-date book on the subject, but a beautiful overview of some important work done prior to 2009. It expands the definition of information visualization by including also 3D approaches. There is also the preceding publication Data Flow 1.