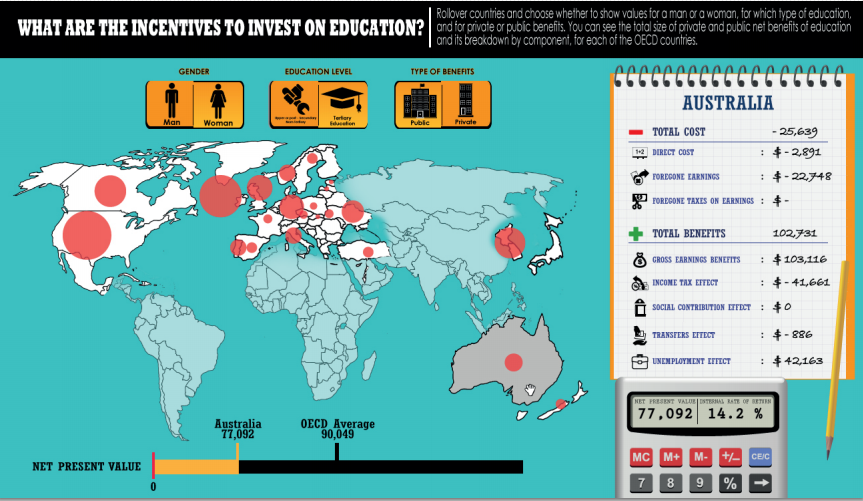
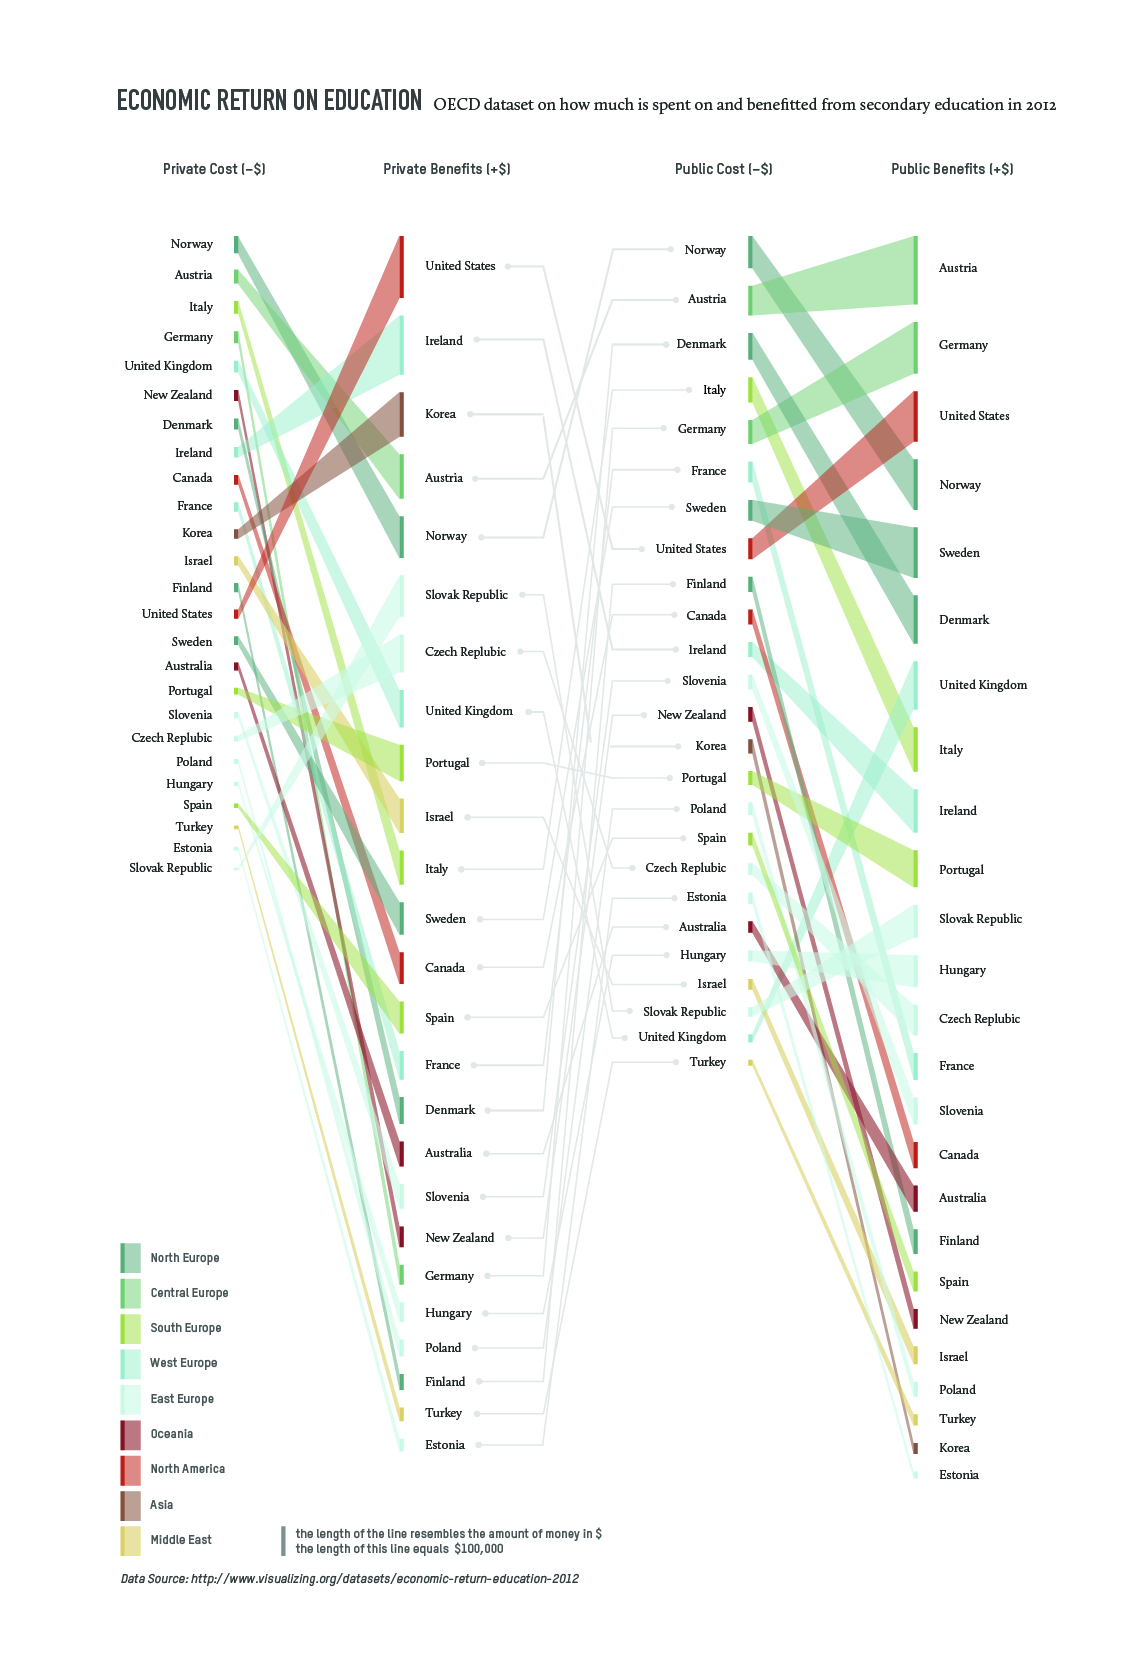
I came across this visualization on visualizing.org on economic returns on education, which provided information on the data source as well (OECD Education at a Glance 2012). The data set contains data on the costs and benefits of secondary and tertiary education for private and public bodies.
While the original displays the numbers interactively, my aim was to focus more on trends and patterns but still create a readable representation of the matter. My solution contains less data than the original, it is not more than a sketch with the option to include more data levels (gender, detailed break up of costs and benefits etc.)