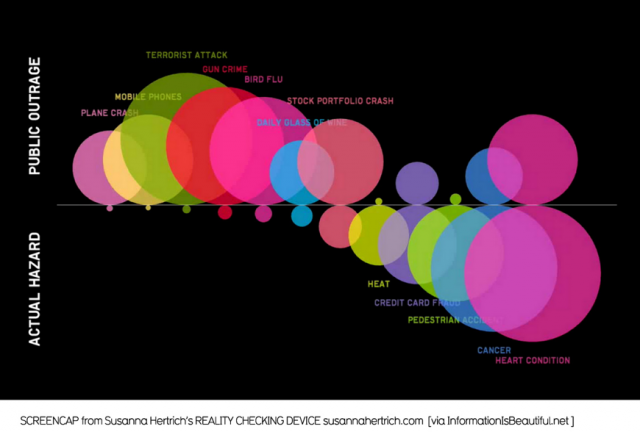
For my code warmup, I chose a pretty simple visualization that showed the comparison of public outrage against life risks versus the actual hazard of each risk. Here is the original image:
Here is the Processing copy:
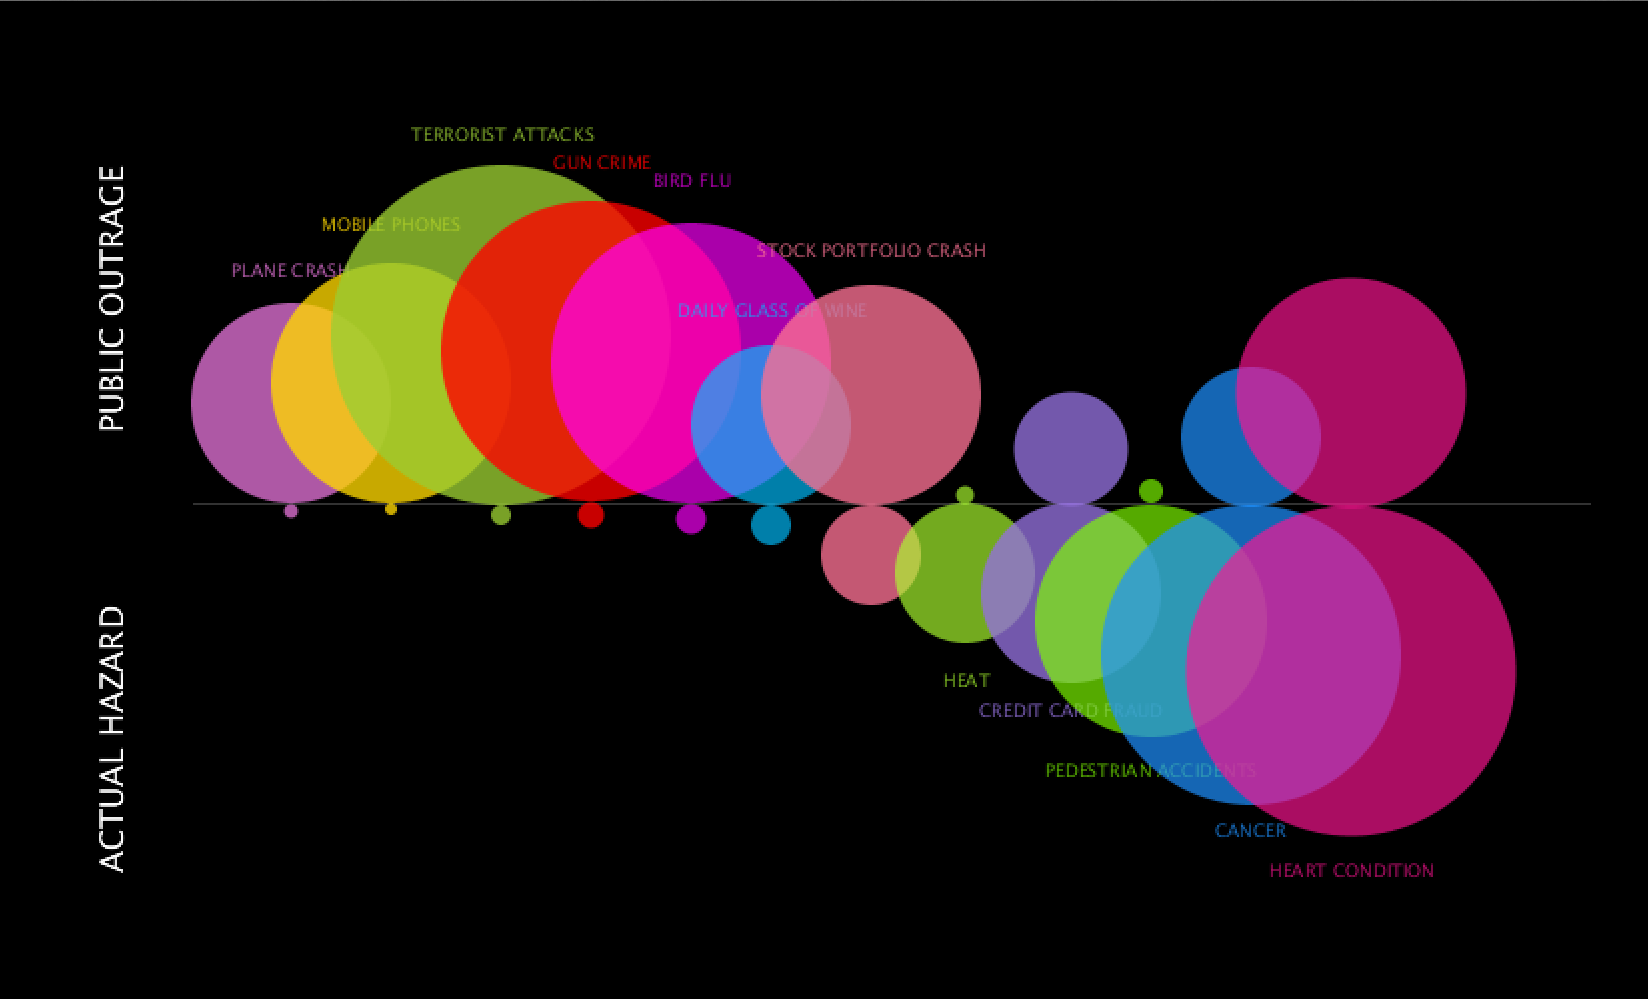
Surprisingly, most of the work was recall of past Processing experience. It was tedious finding exact coordinates and I know there is a way to drag the screen for the coordinates but could not figure that out. Asides from that, the ellipses were just trial and error and eyeballing (and more math than usual in my daily life) to figure out size and placement.
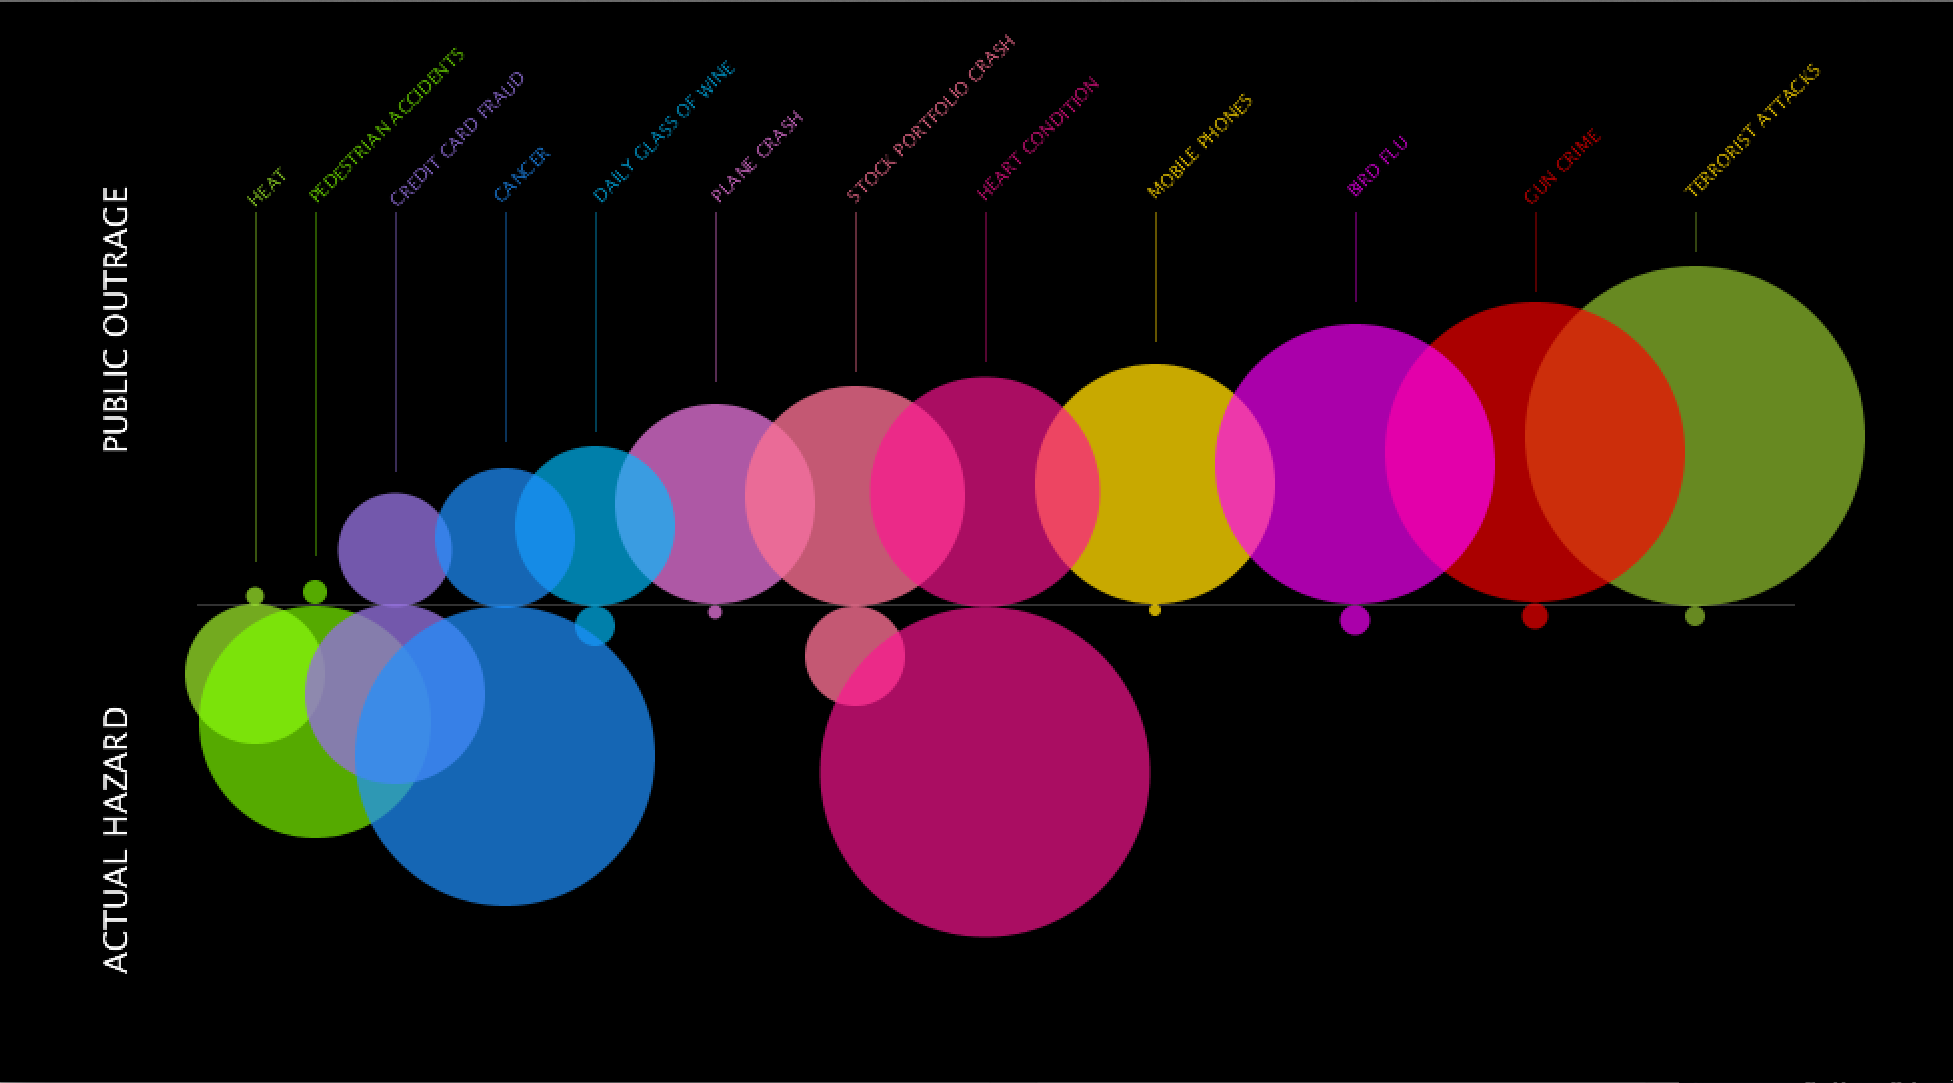
It was a lot more interesting to figure out the next assignment. I decided to make over the same visualization because although it has interesting information, I was curious to see it organized differently. The original layout shows from smallest to biggest actual hazards and their public outrage counterparts. Taking a look at the information is interesting in itself but overall, it felt like both public outrage and actual hazard were competing for attention with the largest bubbles for either side focused on left and right. I wanted to flip it and see the results for smallest to biggest for public outrage. I did a quick sketch in Illustrator and realized that I, myself, read the information more clearly in this layout. Somehow there was cohesion by focusing primarily on the growth of outrage and realizing a bigger negative space for actual hazard. There is more contrast for one side that helps you focus on the other and then make the comparison. Lastly, I structured the titles for each bubble to be above and connected with a hanging line. It was a pain to figure out rotated text, but rationalizing comes a long way in code and sometimes things just came in place which made the process a lot more fun. This is the redo: