Subject
For the final assignment, I will make a visulization that reflects up-to-date data regarding popularities of musical artists in order to show which musicians are the most popular at the moment. I like listening to music and am interested in pop culture. Even though this does not mean that I like all the musicians, it is always interesting to see not only other people’s opinions on popular musicians who I don’t like that much, but also “stars” themselves brighting the most now. Competition between musicians is very intense, but I can rarely feel it because of a different notion between being popular among the public and the popularity you can actually sense. This visualization will display both the rank of musicians according to their popularities, and their corresponding reactions online, which can be flowing out endlessly on Twitter, Instagram, and Tumblr; after all, it eventually lets you know which “star” shines the brightest.
Data
The main data that I will source is Echonest, which provides various and in-depth information related to music. What they provide is a lot of methods that return data ranging from artists and songs to their profiles, popularities and reviews. The most important part that I’m going to use specifically is the rank of “hotttnesss,” which indicates how popular one particular artist or song is at this moment. Besides Echonest, I will use Twitter API library on Temboo (as well as Instagram API, probably though) to retrieve some twits that contain hashtags related to certain musicians so that you can see people’s thoughts about the popularity. Both Echonest and Twitter API are hard to manage because of their massive volume and the fact that the way to get the data is pretty tricky, but once I am able to get the data, it will definitely allow me to make an interesting visualization.
Tool
Tool that I’m going to use is Processing just because it is the most comfortable tool to me so far, still difficult though. However, if the data becomes manageable, because the data I’ll use is Jquery, I’m thinking of change the code to Javascript so that I can make it accessible to anyone online through my website.
Comp
I have two different versions I’m thinking of for the final visualization. The first version emphasizes how much each artist dominates in the rank, and the second version focuses on the similar hierarchy between the solar system, and “star” and songs.
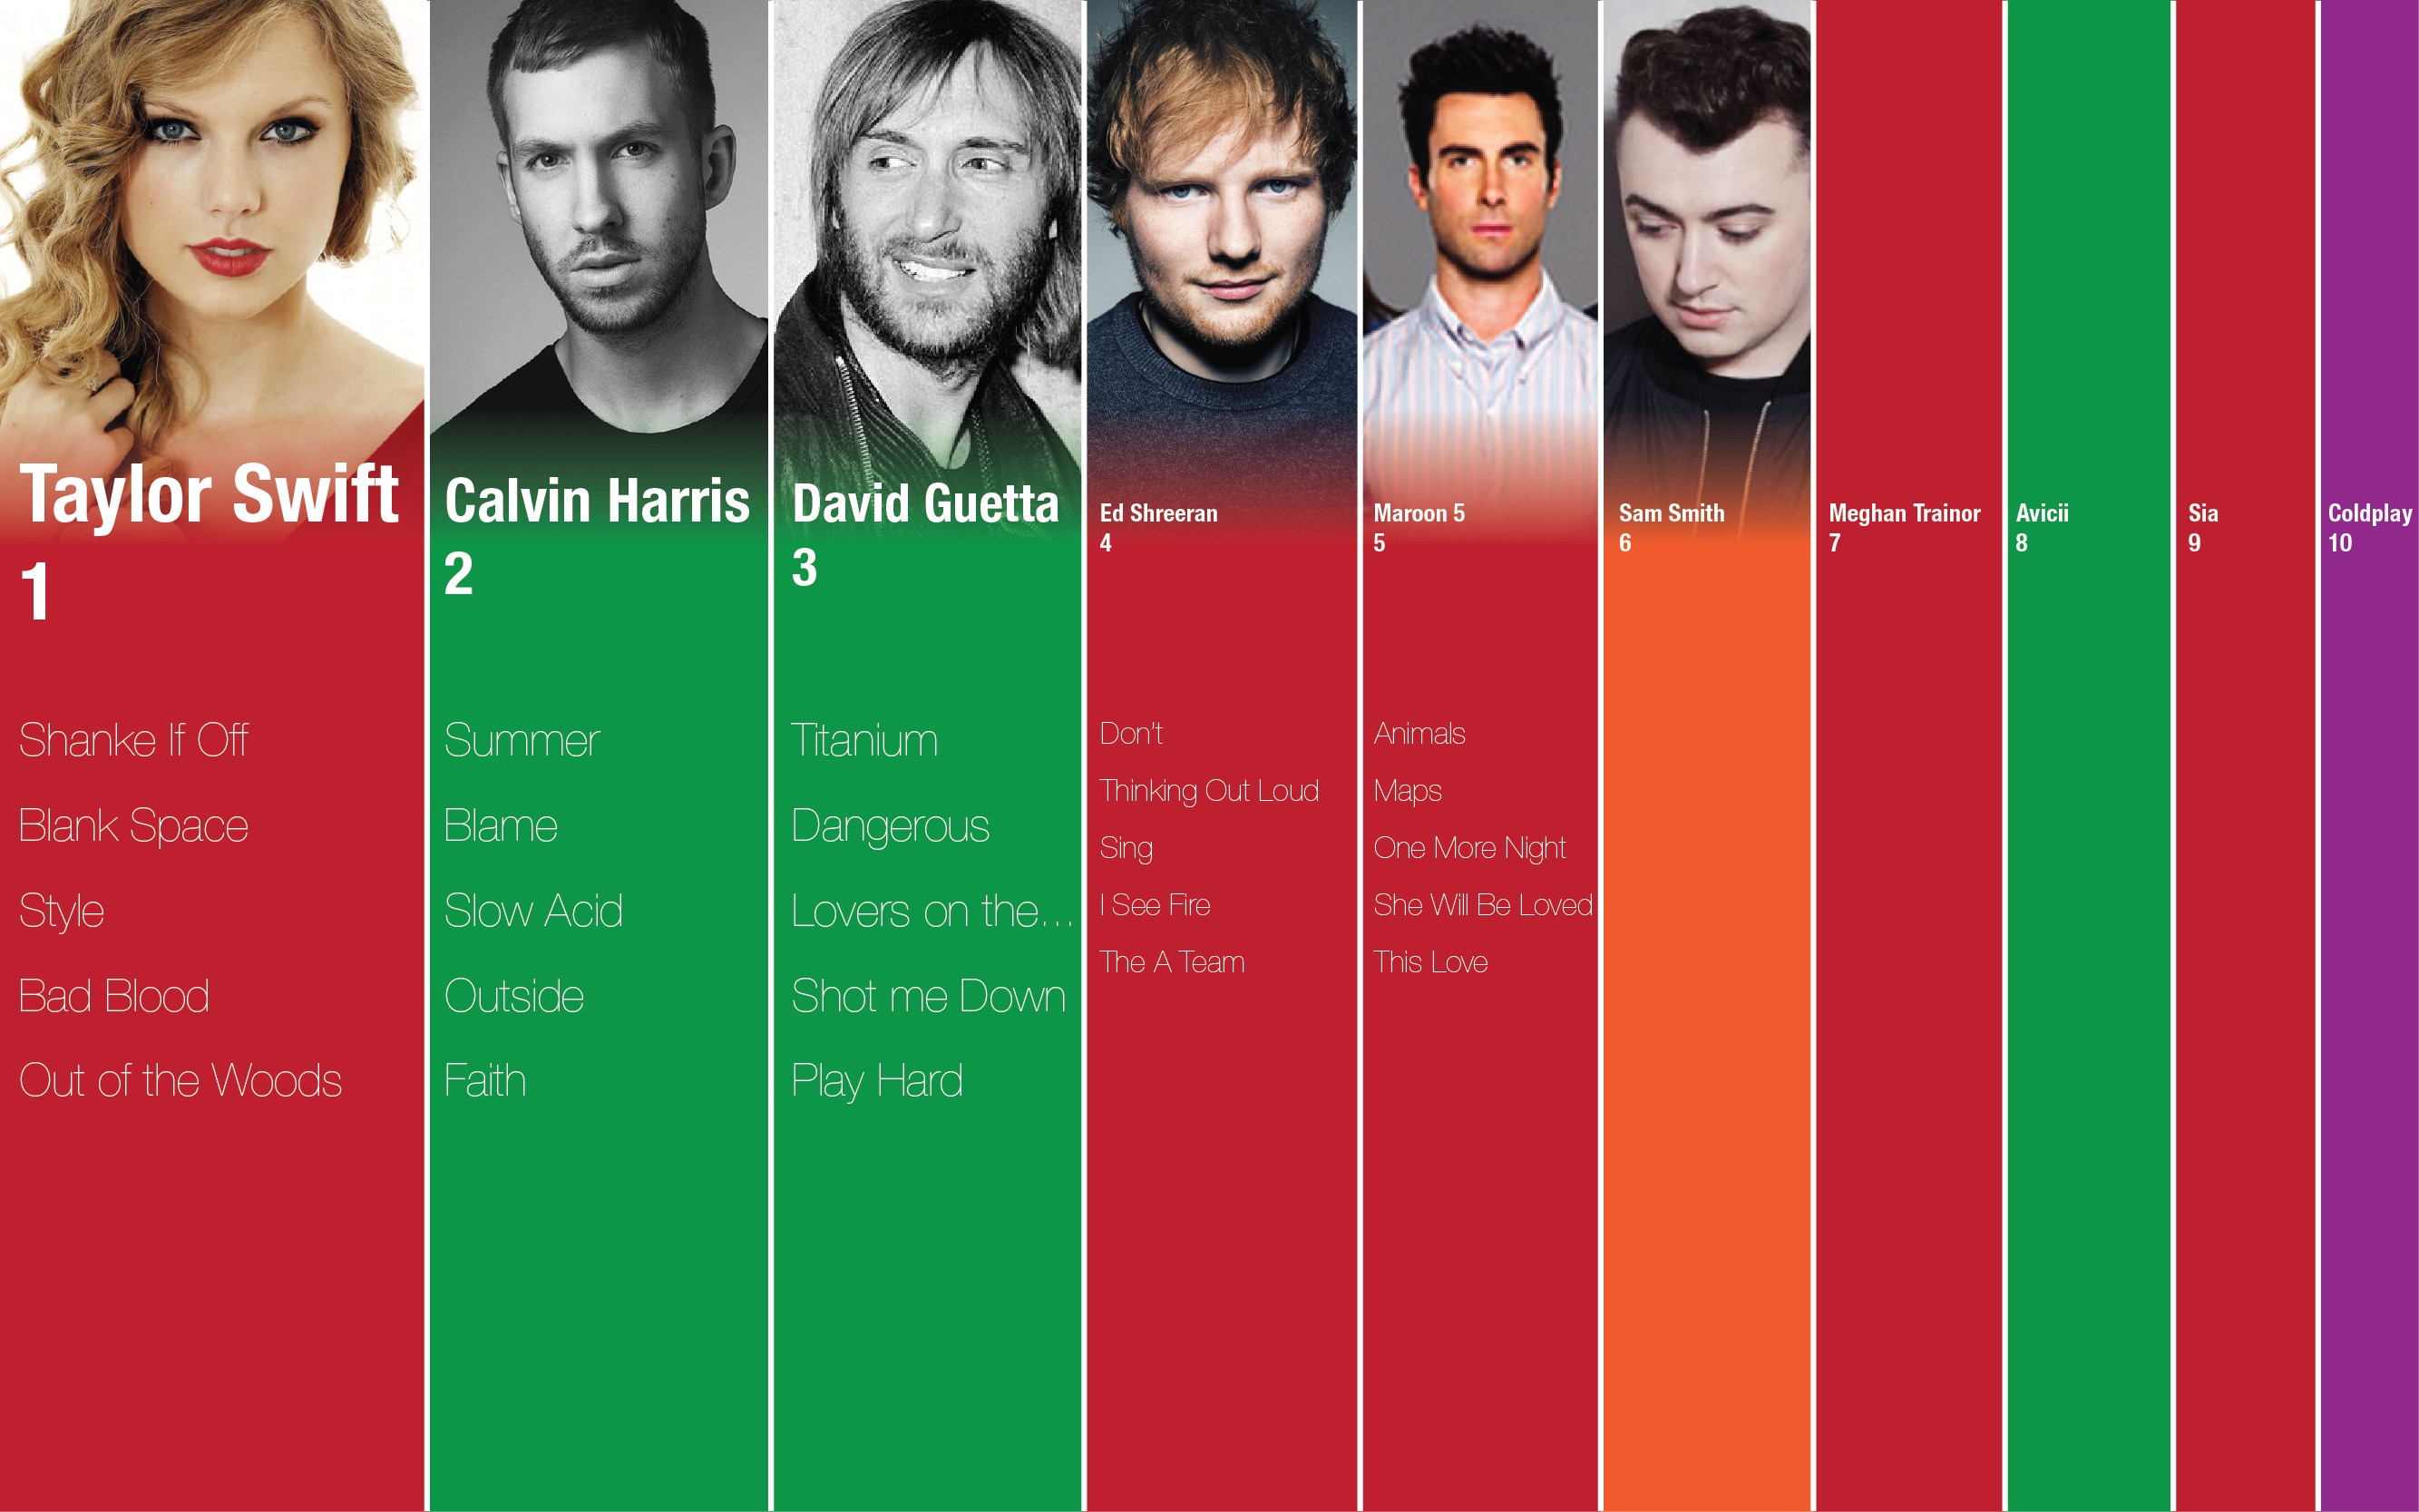 ver.1
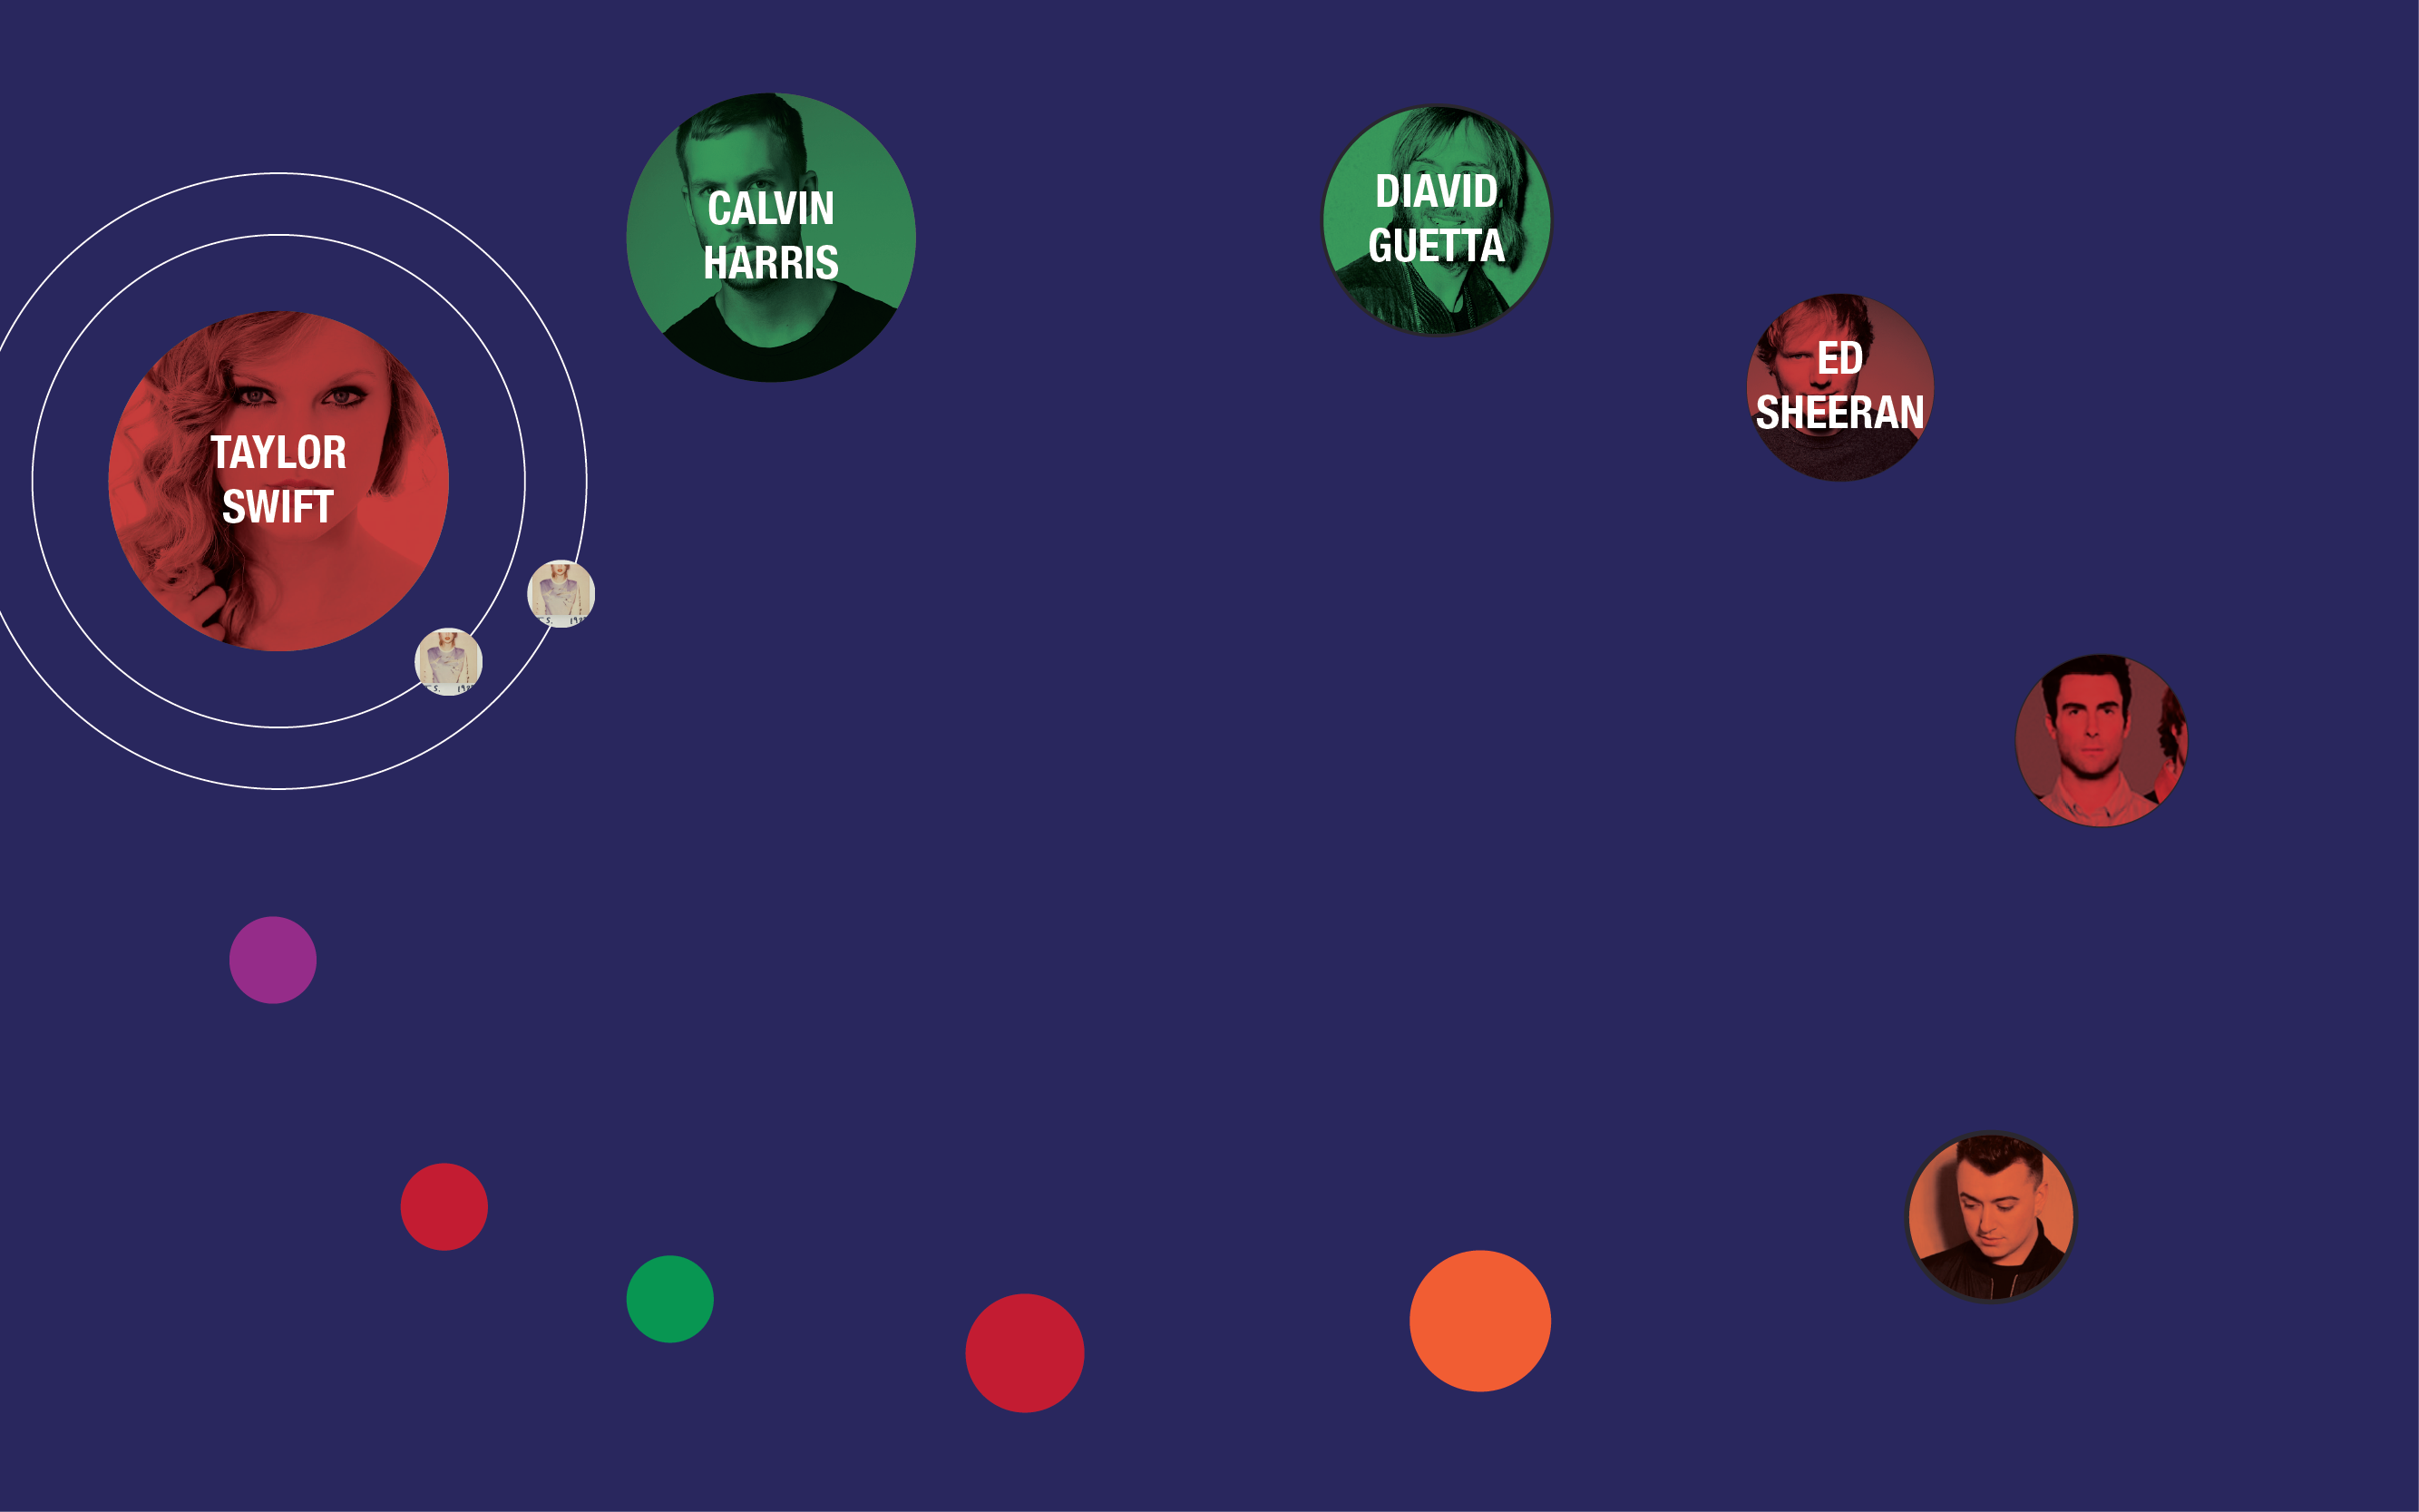 ver.2