Find an effective way to extract the data.
First, I needed to get my data from the Organ Procurement and Transplantation Network which was in the form of HTML tables with no link to click on to get the data a .CSV or .XML. I did, however find this site, Convert CSV, that converted HTML tables into CSV files. It has the option of entering in an URL but the link to the data didn’t work because it was interactive. Instead, I downloaded the HTML code of the site when it loaded the data I wanted used the option of uploading HTML files to the Convert CSV site and chose the table I wanted to convert. It worked but all the labels were missing (years and organ donated). That isn’t a problem when entering the programming stage because all I need are the numbers and I can just add the labels myself. It works way better than transferring the data by hand myself.
Importing and plotting the data.
Second, I need to visual the data. In my comp I used stacked bar graphs to do this. I took the code used in class and tweaked it to fit my data. I had to change all the floats to ints and make sure my arrays were not out of bounds (which kept popping up as an error until I fixed it.) Also, after looking at the stacked bars, I am debating on whether or not it should be a stacked bar graph or just separate bar graphs.
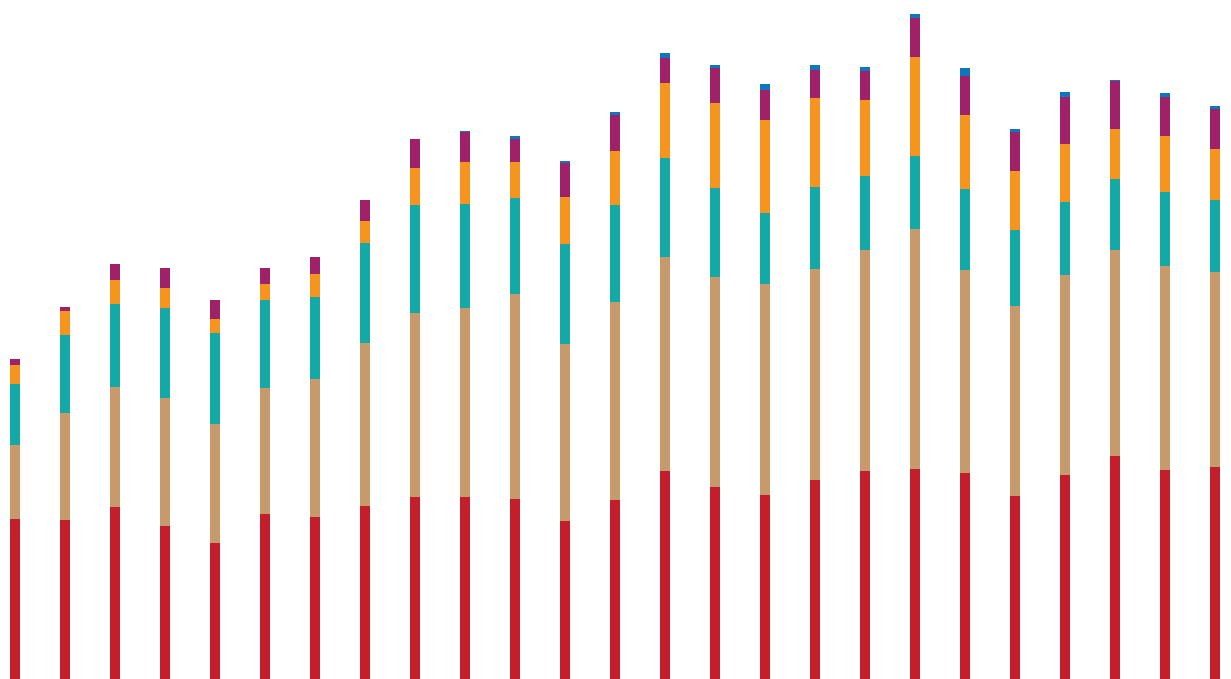
Code: POC
Get the visualization into Illustrator to tweak.
The only problem I had was that at first illustrator was unable to read the file. Which was weird because it clearly said it was a PDF. Then I went back into the code and realized I forgot to add endRecord(); at the end of the code.
