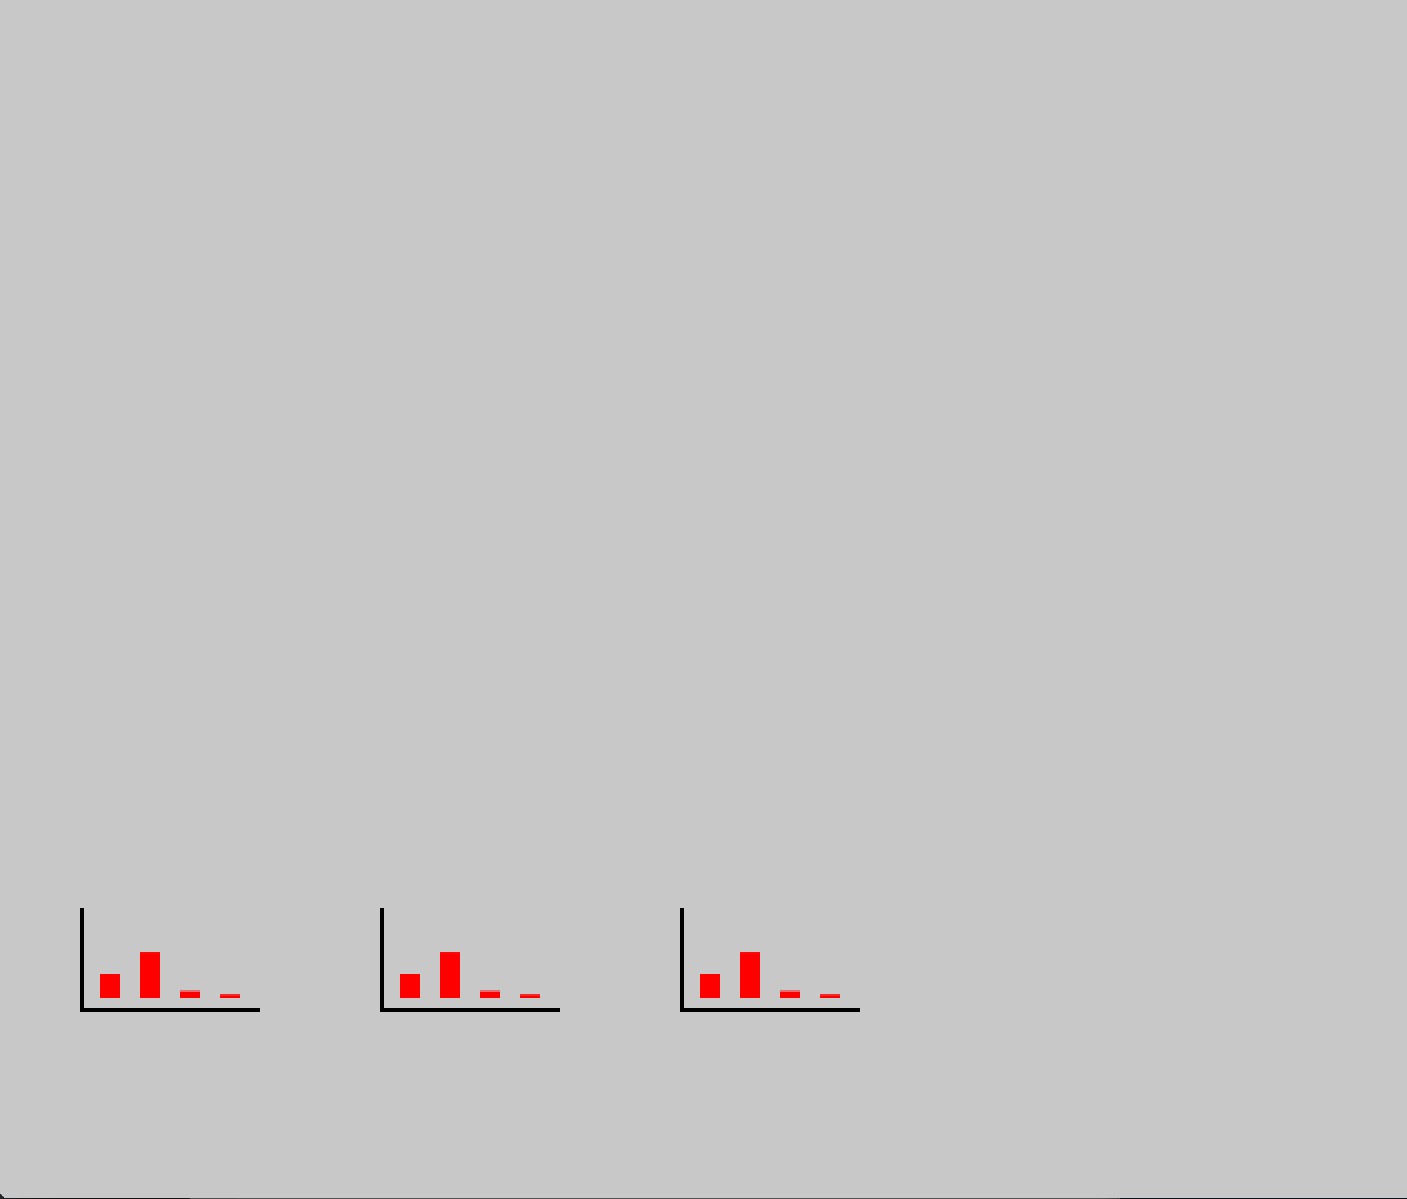
For my next set of data, I am creating a series of bar graphs that analyze web anonymity behavior, experience, and beliefs of about 700 individuals. To do that, my proofs of concept are:
1. Make a bar graph for each “yes”, “no”, “not sure”, and “refuse to answer” response for each question.
1a. Combine several questions into one; have you ever (a,b,c,d,e,f,g) => yes, no, etc? If a = yes, b = yes, c = yes, then… make a yes graph.
2. Place all questions in one space, see how it looks.
3. Organize data, pull out just the yes and no questions and see if they are equal in weight of behavioral and perceptual questions.
What I was able to do:
1. Can’t figure out how to let Processing count same values within a column. For example, how many times did people answer yes (or 1) to the first question? If answer = 1, then count how times 1 occurs and make a bar out of that value.
1a. ^
2. WIP
3. WIP
All I got: