Tag Archives: final assignment

Final Assignment Documentation

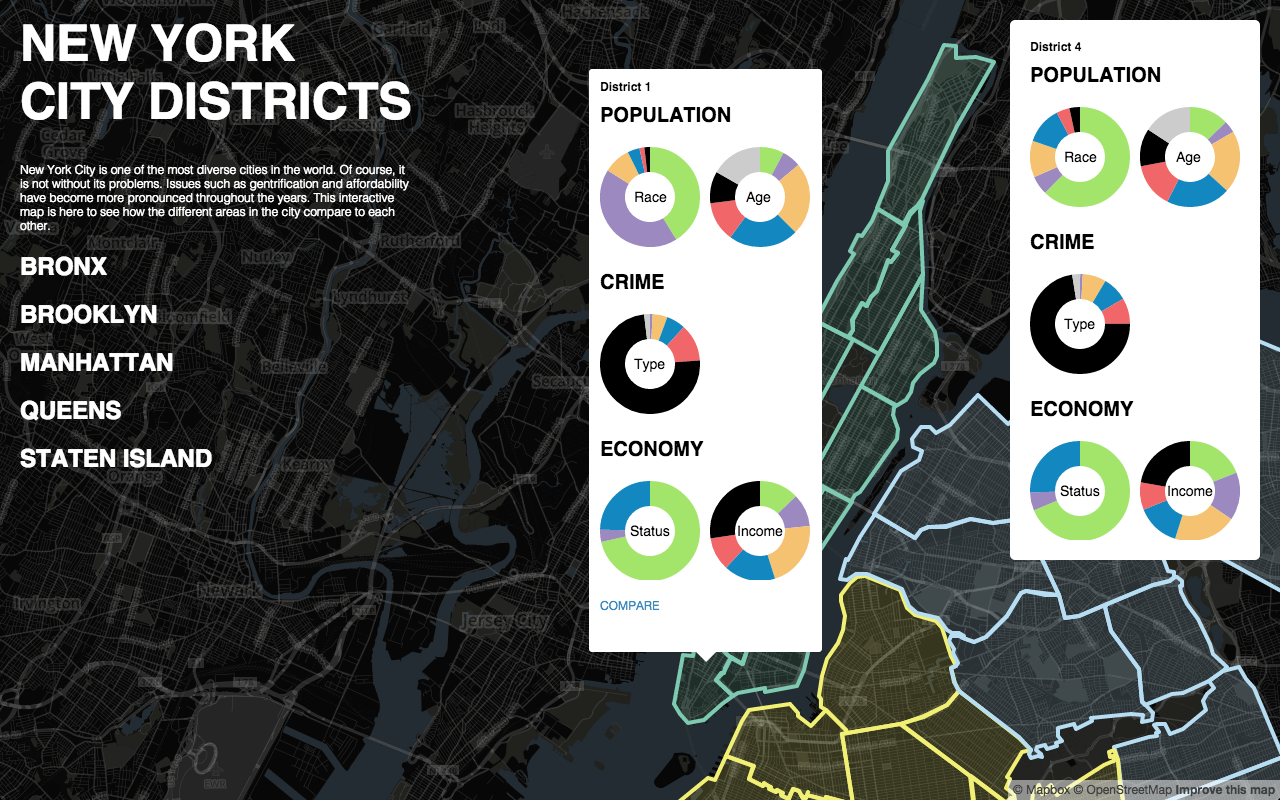
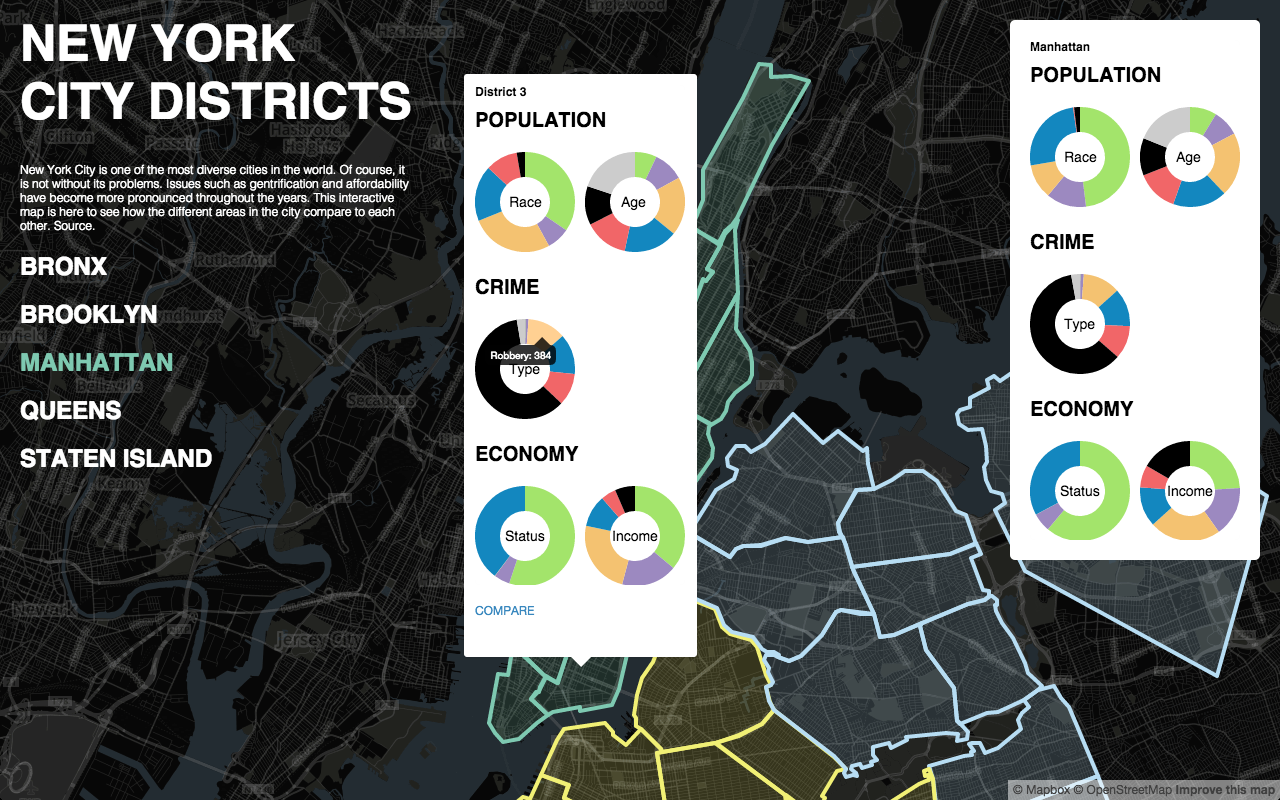
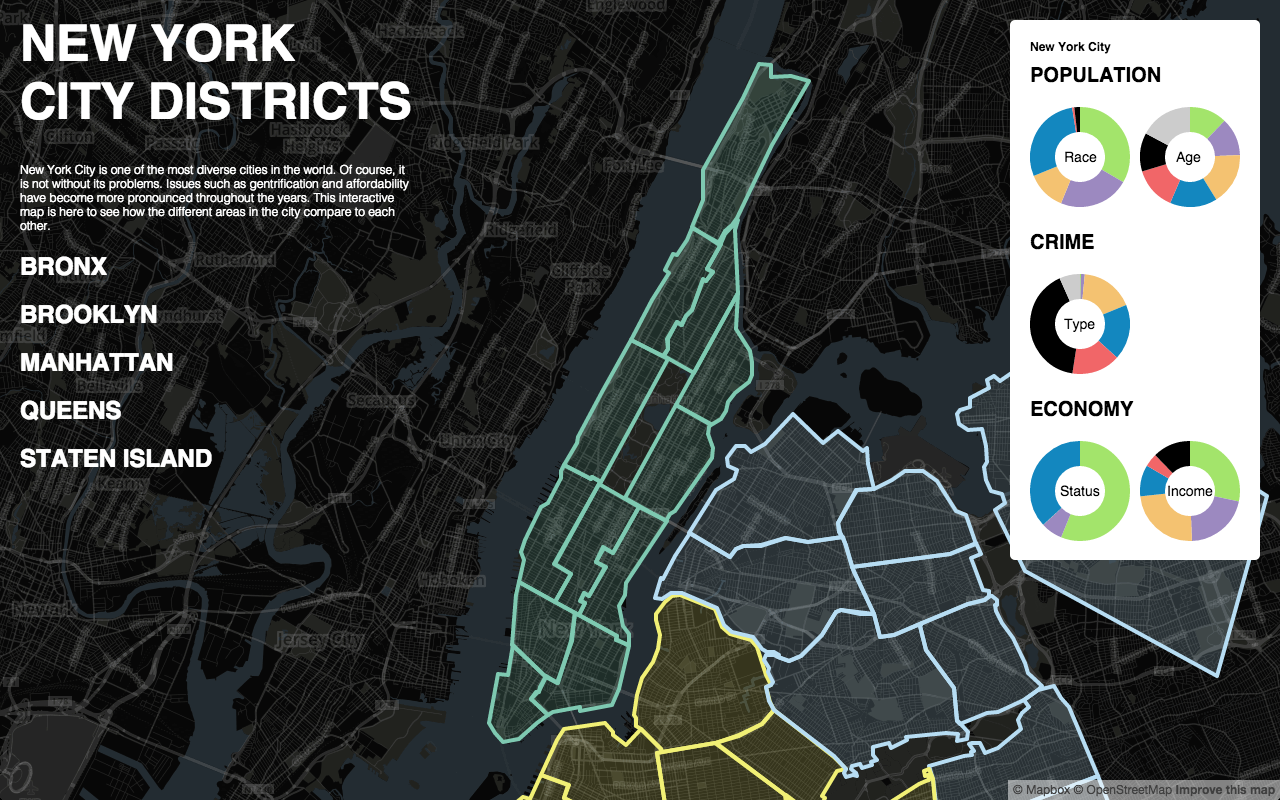
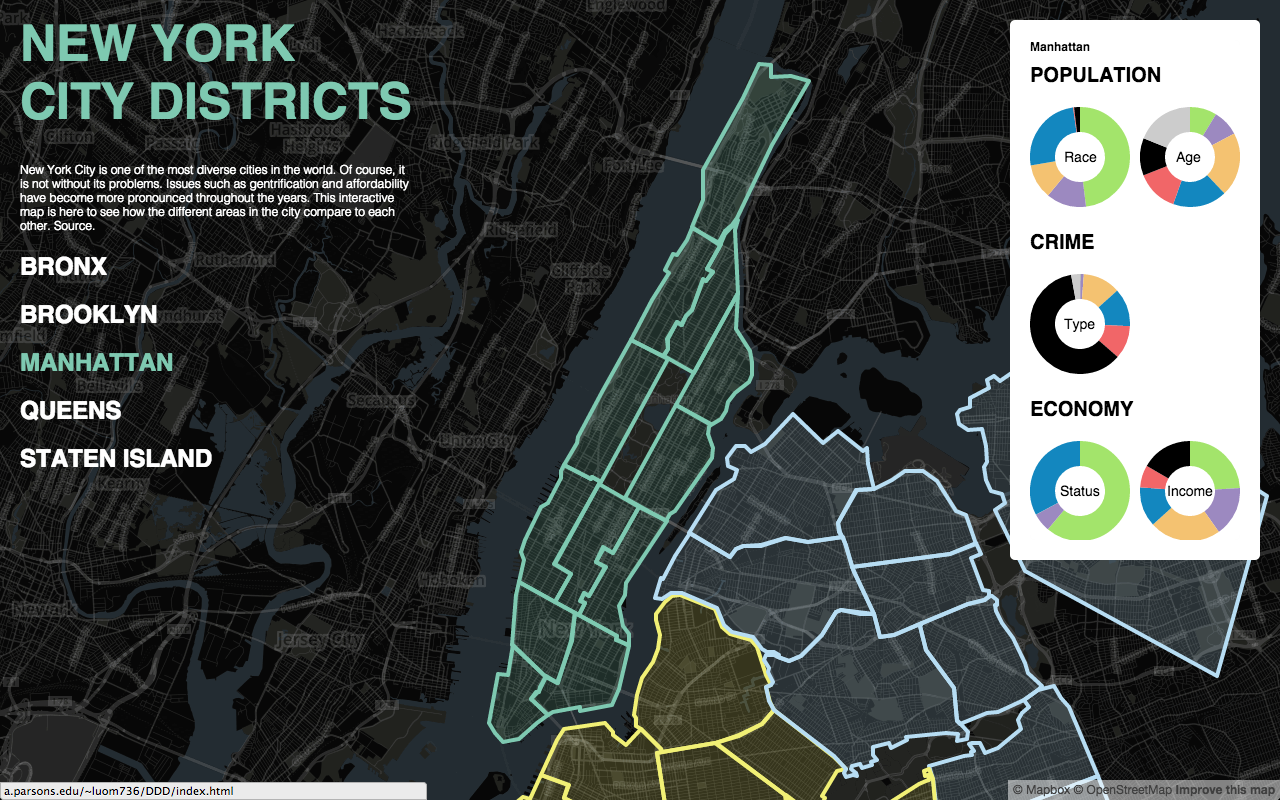
For the final assignment, I made an interactive map of New York City (Manhattan only for now). I have lived in the city for all my life but in the more recent years I have heard about issues with rising property costs and affordability as well as gentrification. People have started to believe that it will ruin how diverse the city can be by pushing out the people who cannot afford to live here such as budding artists. I wanted this map to show the makeup of each district to see how they compare to each other. I got most of my information from the nyc.gov site. There is a lot more information available on each district that I may want to include in the future (such as type of housing residents live in, type of jobs they have, how they commute to work, how large the families are, etc.)  but for now I only included the most general information.

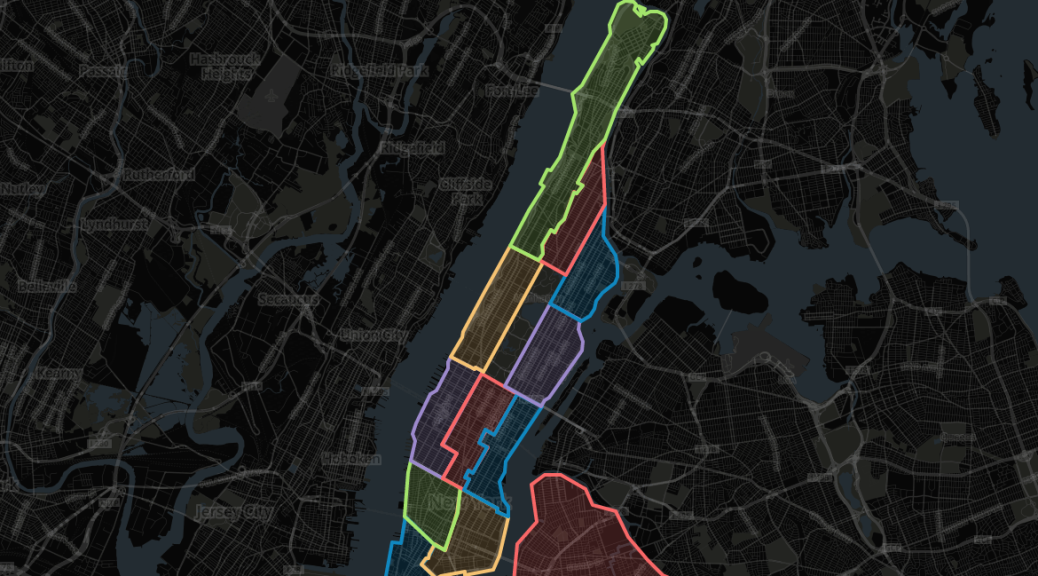
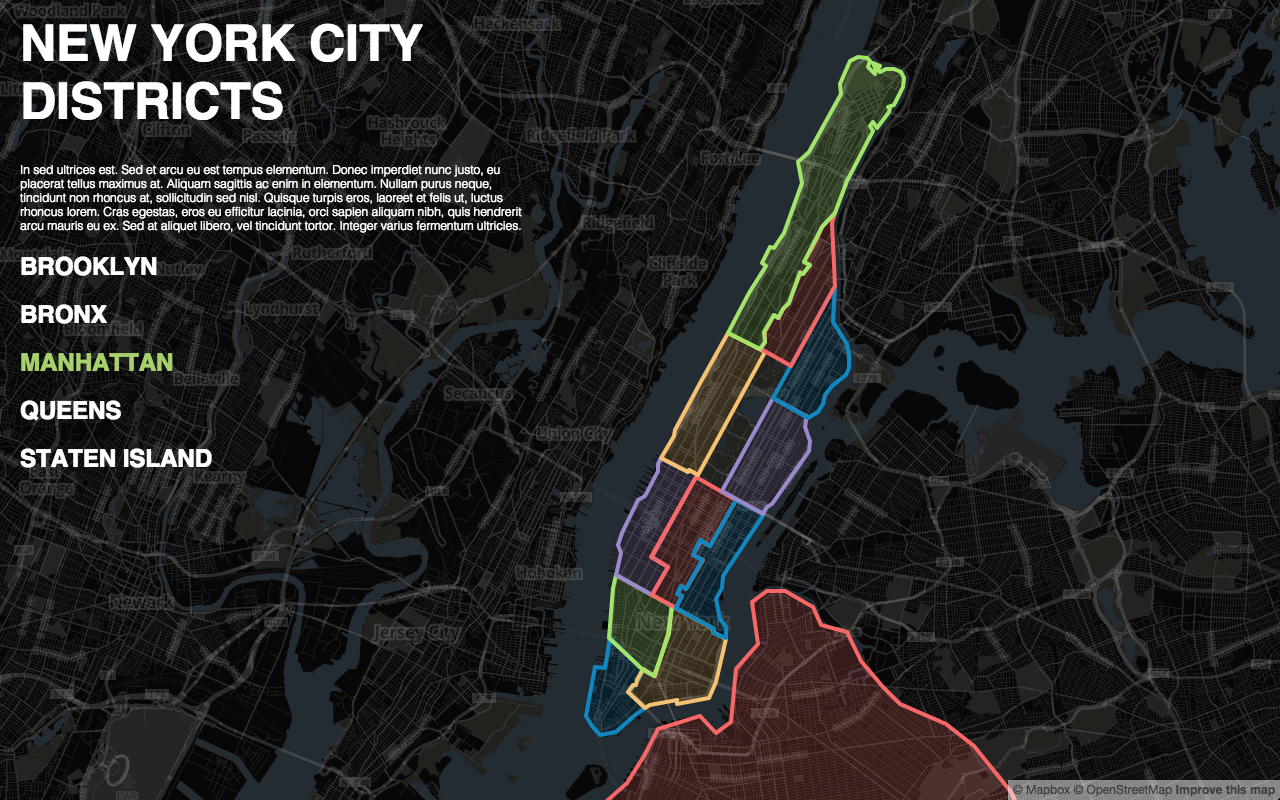
I used Mapbox to make the make the interactive map and then used HTML, CSS, and JQuery to make the rest of the site. The most difficult part of the project was trying the make the Mapbox program listen to commands from my site so that I could go into the map and connect it to the links on my site. Also, drawing out the districts on the map was the most time consuming. It took forever to make sure the district lines were being drawn on the right streets. Mapbox only has general areas drawn out such as the states borders and country borders.
Screen Shot 2014-12-14 at 12.47.46 PM


Screen Shot 2014-12-14 at 1.56.22 PM

Screen Shot 2014-12-14 at 1.42.15 PM


Screen Shot 2014-12-14 at 1.57.37 PM

Site: New York City Districts


Final Assignment

Instagram API

I was originally intending do something with the Instagram API. I wanted to be able to color analyze and geolocate the most popular photos of a certain hashtag. I looked up Color Thief.js, as suggested  last week, and it looked great. Except the major portion of what I needed came from the Instagram side of things and that was not working out.

I had set up the account and got the Client ID and tried to get the data to my site. It is not working for me. It doesn’t help that I don’t even know if I set up the account right (I have a Client ID and Secret) but every time I Google for help every site takes me back to the same place – Instagram. There IS a lot of information there but I can’t make any sense out of it. So I tried looking for third party help such as Instafeed, or this, or this helpful site by IBM, and this helpful Github site. All I ended up getting was a blank page or an error message. Which makes me believe I’m not doing something right…(also don’t know how PHP works). Here is what I thought might be a hopeful working sample (it was not).

Interactive

So for now, I decided to work on an interactive map of the New York City districts as to compare the living and economic situations. It isn’t too far from what I needed for my original idea so if I get that API stuff working I can just incorporate it into the map.

Data

NYC Neighborhoods Map

NYC Demographics

NYC Crime Map

NYC Population

NYC Economic Characteristics

POCs

1. Interactive Map – click places on the map and have stuff show up. (Mapbox is awesome.)

2. Stuff that shows up should be relevant – as I was working on the map I was having a hard time getting the polygons on the map to interact with my side of coding. So for now, I got a way to put infographics into the description of each district.

3. Pie Charts

Pie Chart

Screen Shot 2014-11-17 at 6.22.03 PM

NYC Districts