
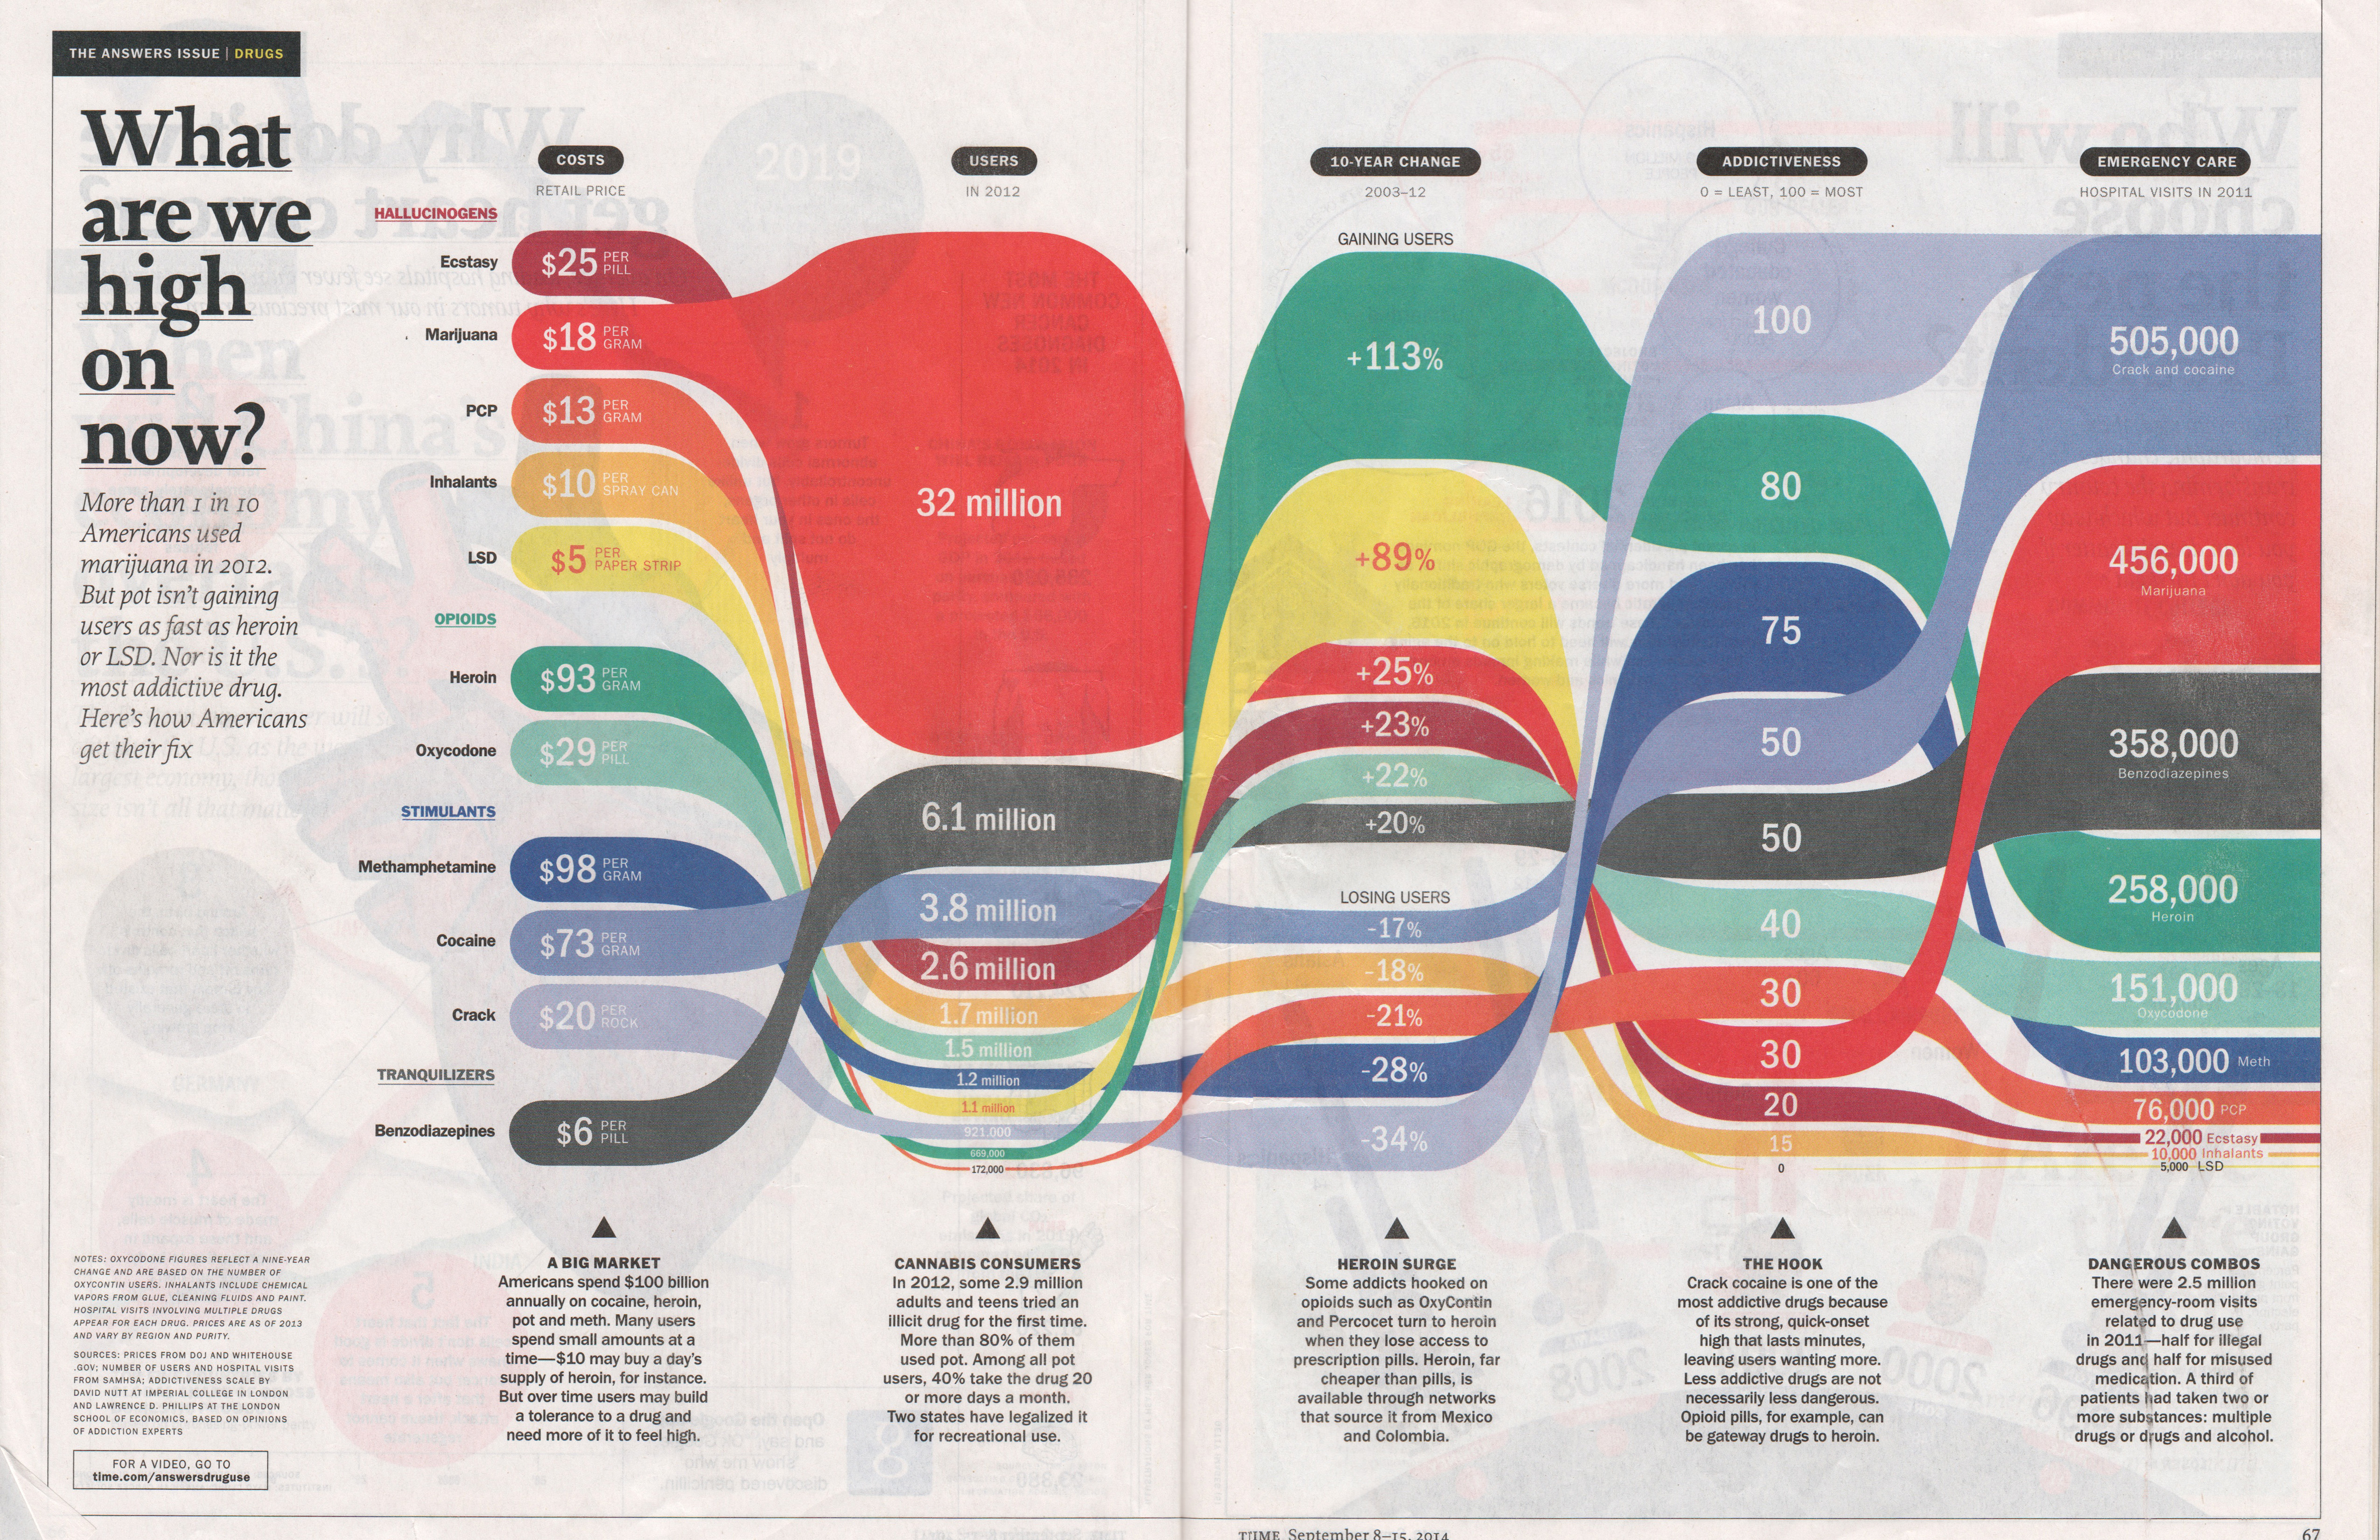
I chose to do another infographic I found in “The Answers Issue” of Time Magazine. I did was able to do everything in Processing except for the spaces between the columns when the colored bar for each drug transitions into the next column; those are svgs. It was a pain in the ass to center all the text within the shapes and was also difficult to calculate each shape with variables so that when I changed the height of one shape, it will change all of them. It was also hard to see it the colored bars were proportionate to each other. I don’t even think Time Magazine has it proportional (they do have to fit the image into the magazine).
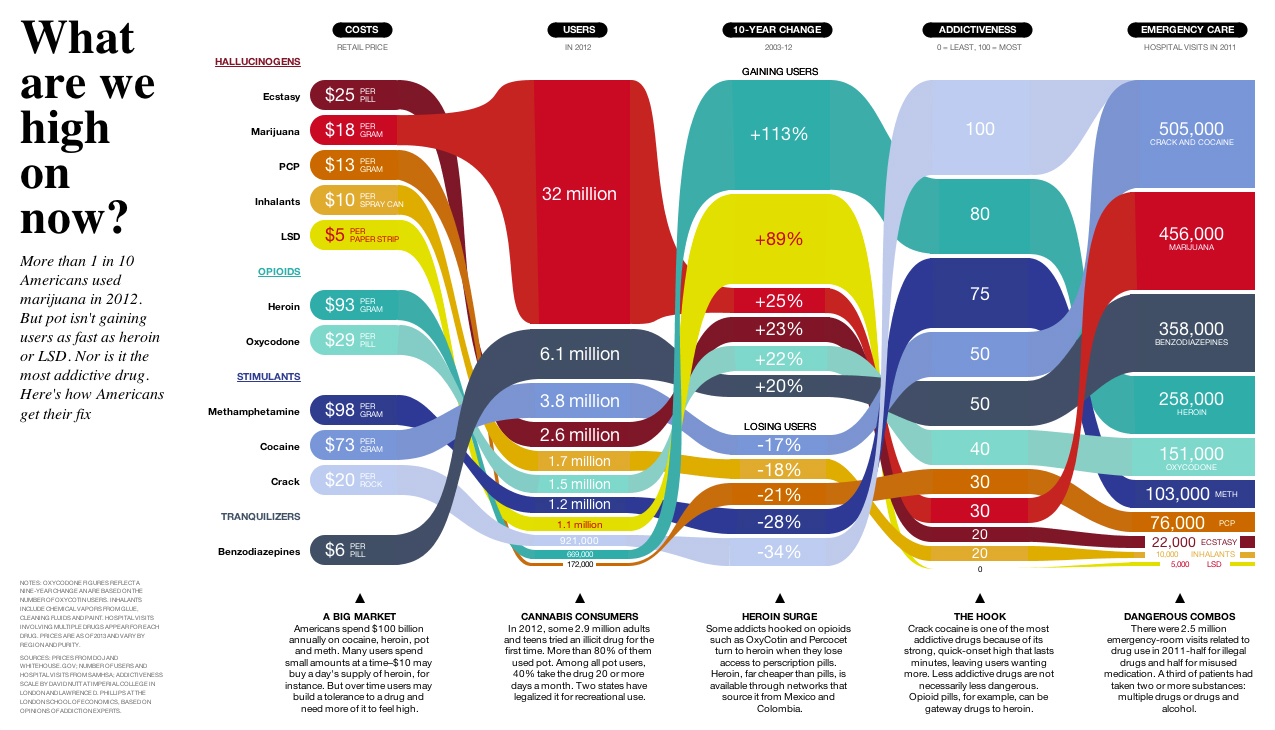
Code: What are we high on now?
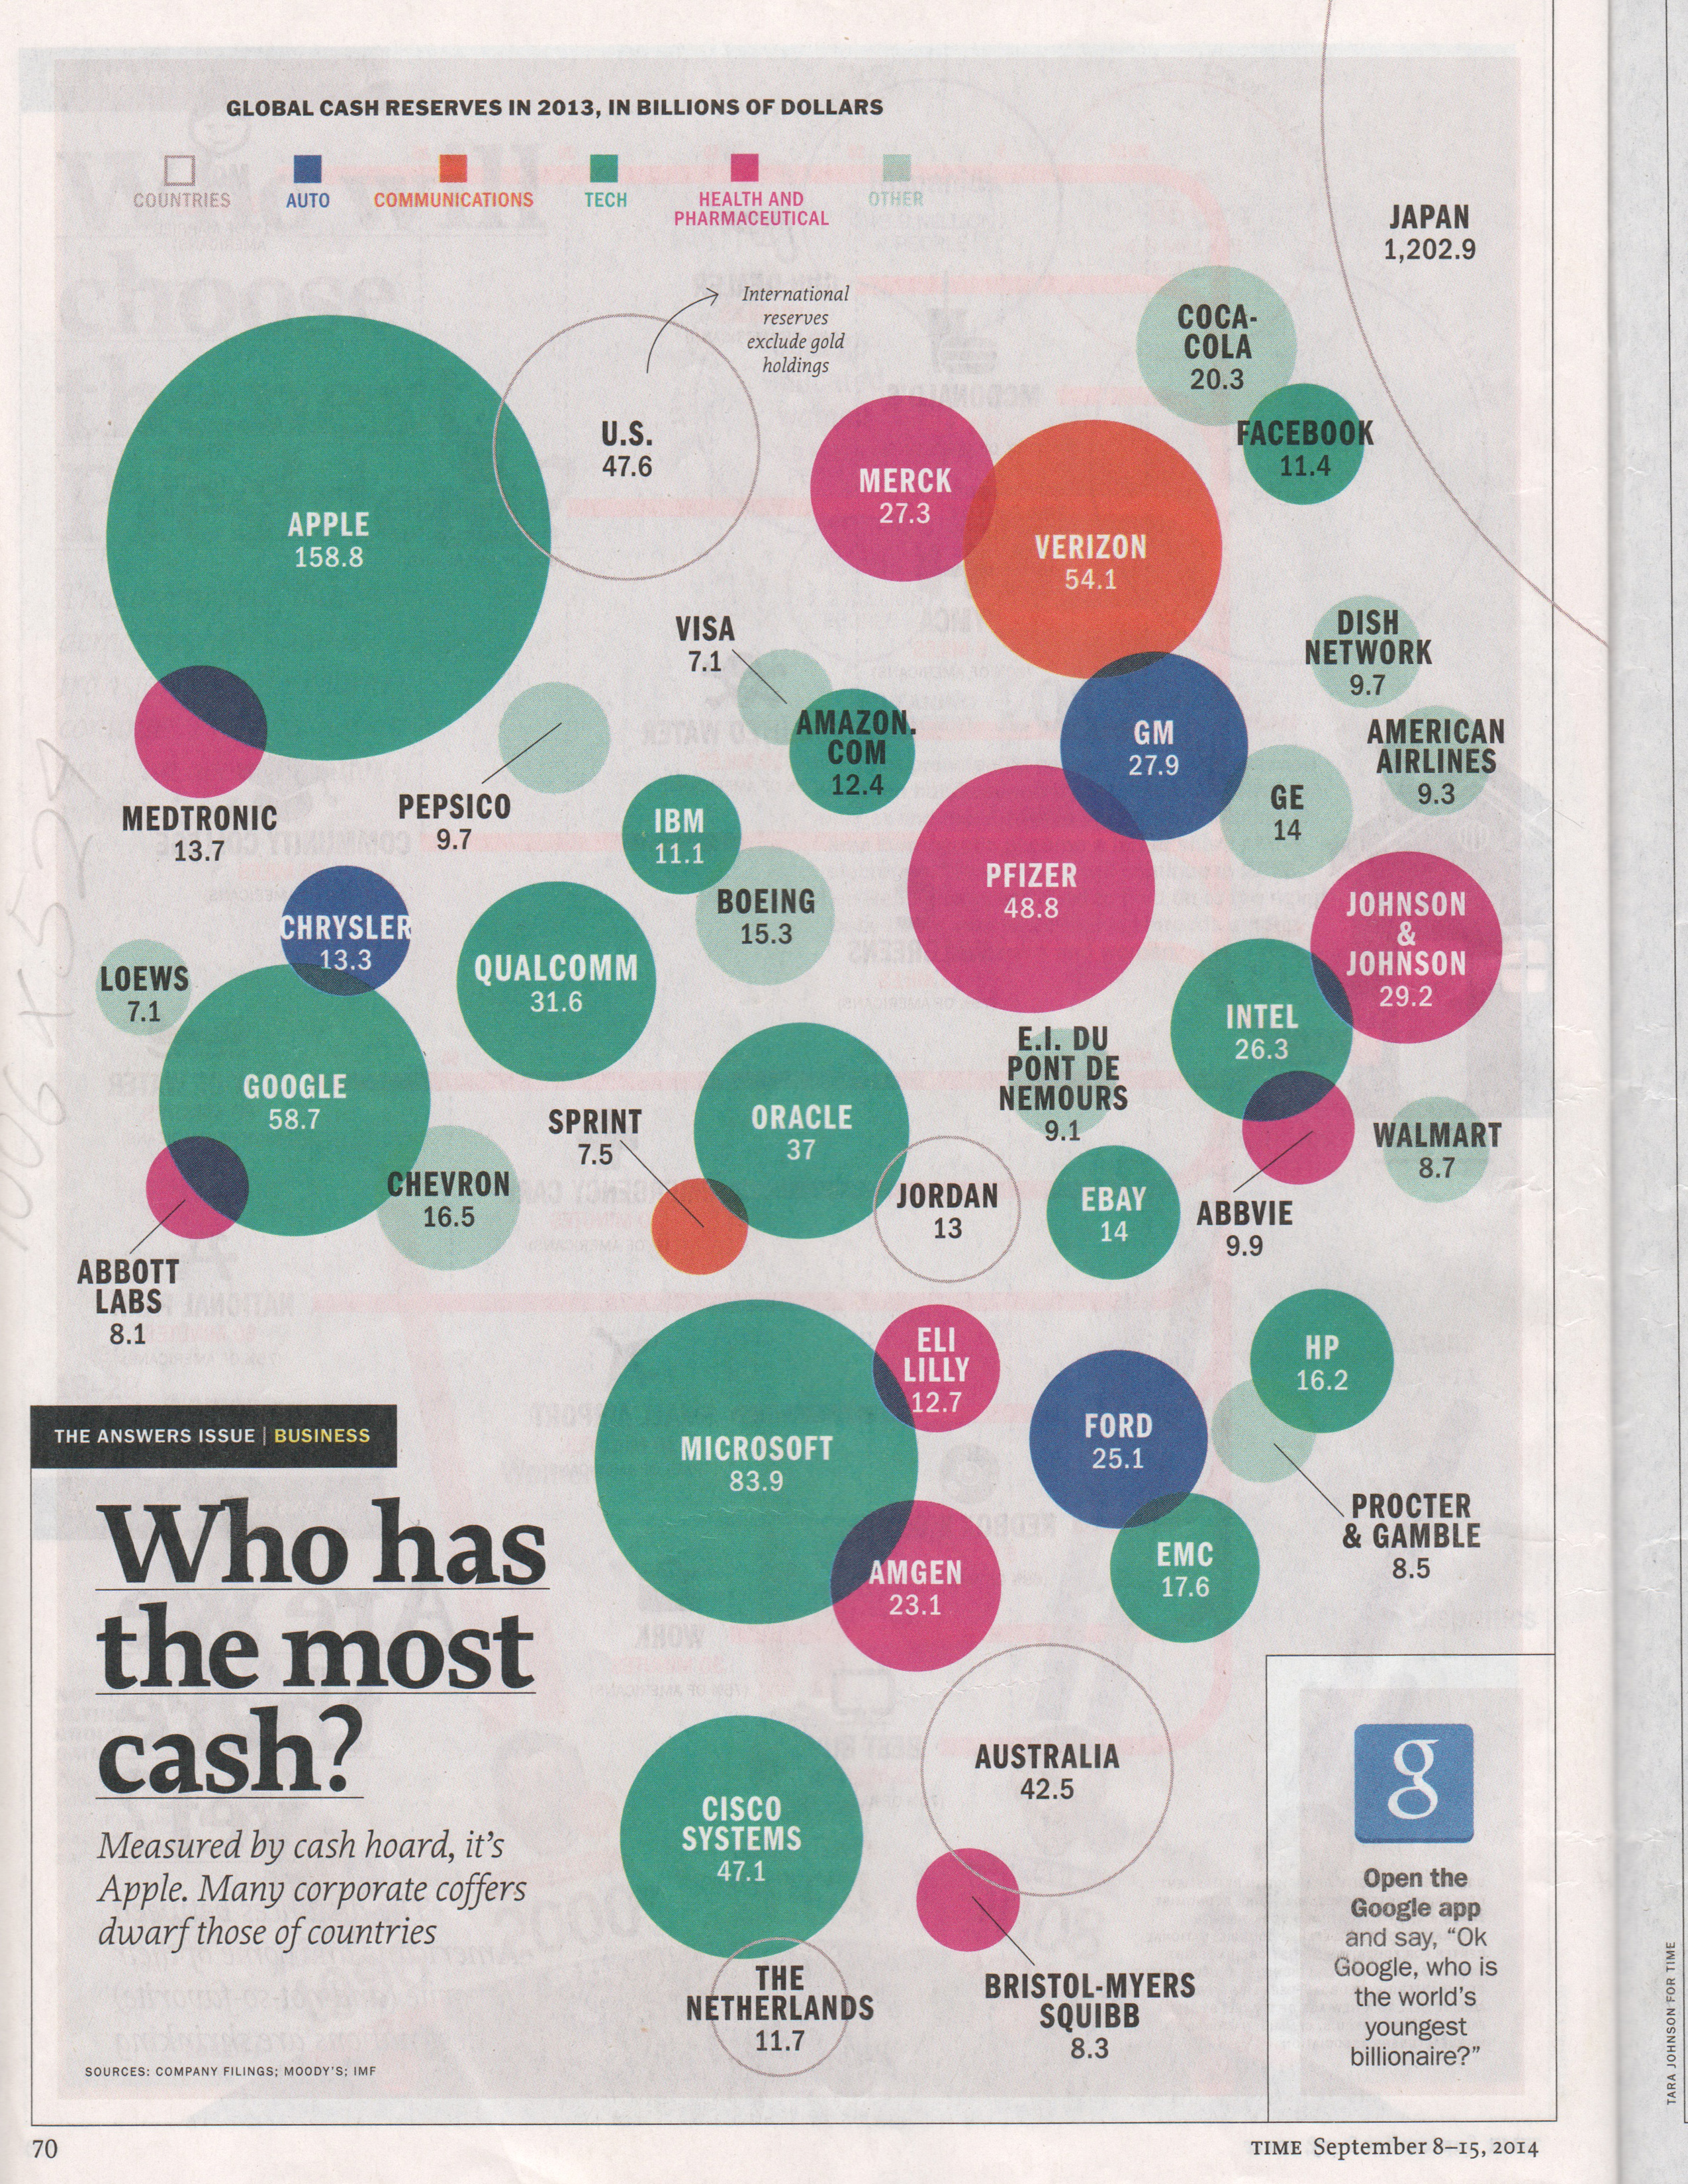
This is also from Time Magazine. It was a little hard to get the circles proportionate to each other because I was not sure of what the scale/ratio was. Positioning was also difficult; I wish there was grid on Processing. This visualization, compared to the top one, has all the shapes made in Processing (no svgs).
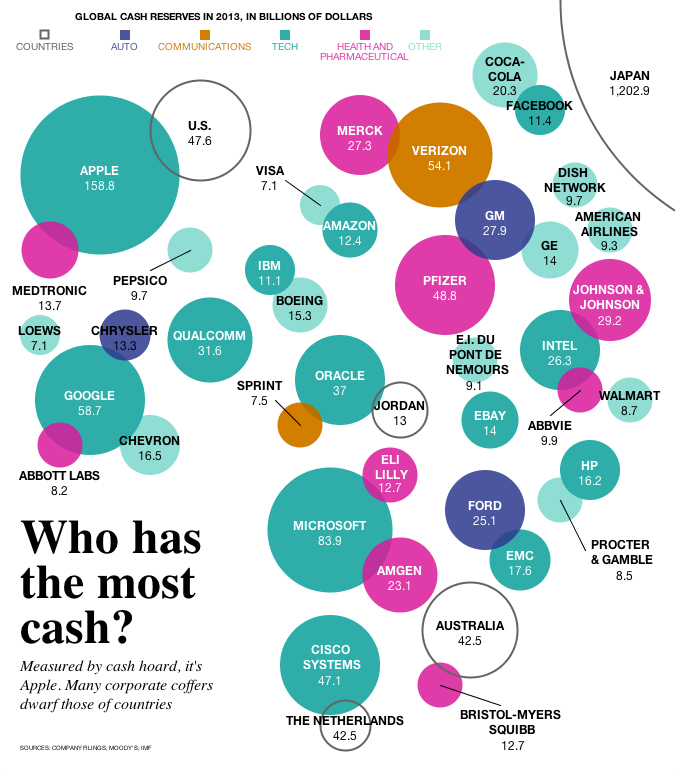
Code: Who has the most cash?