Tag Archives: code warm up

Code Warm Up Part II

Pre-Illustrator

Screen Shot 2014-09-29 at 6.58.44 PM

After-Illustrator

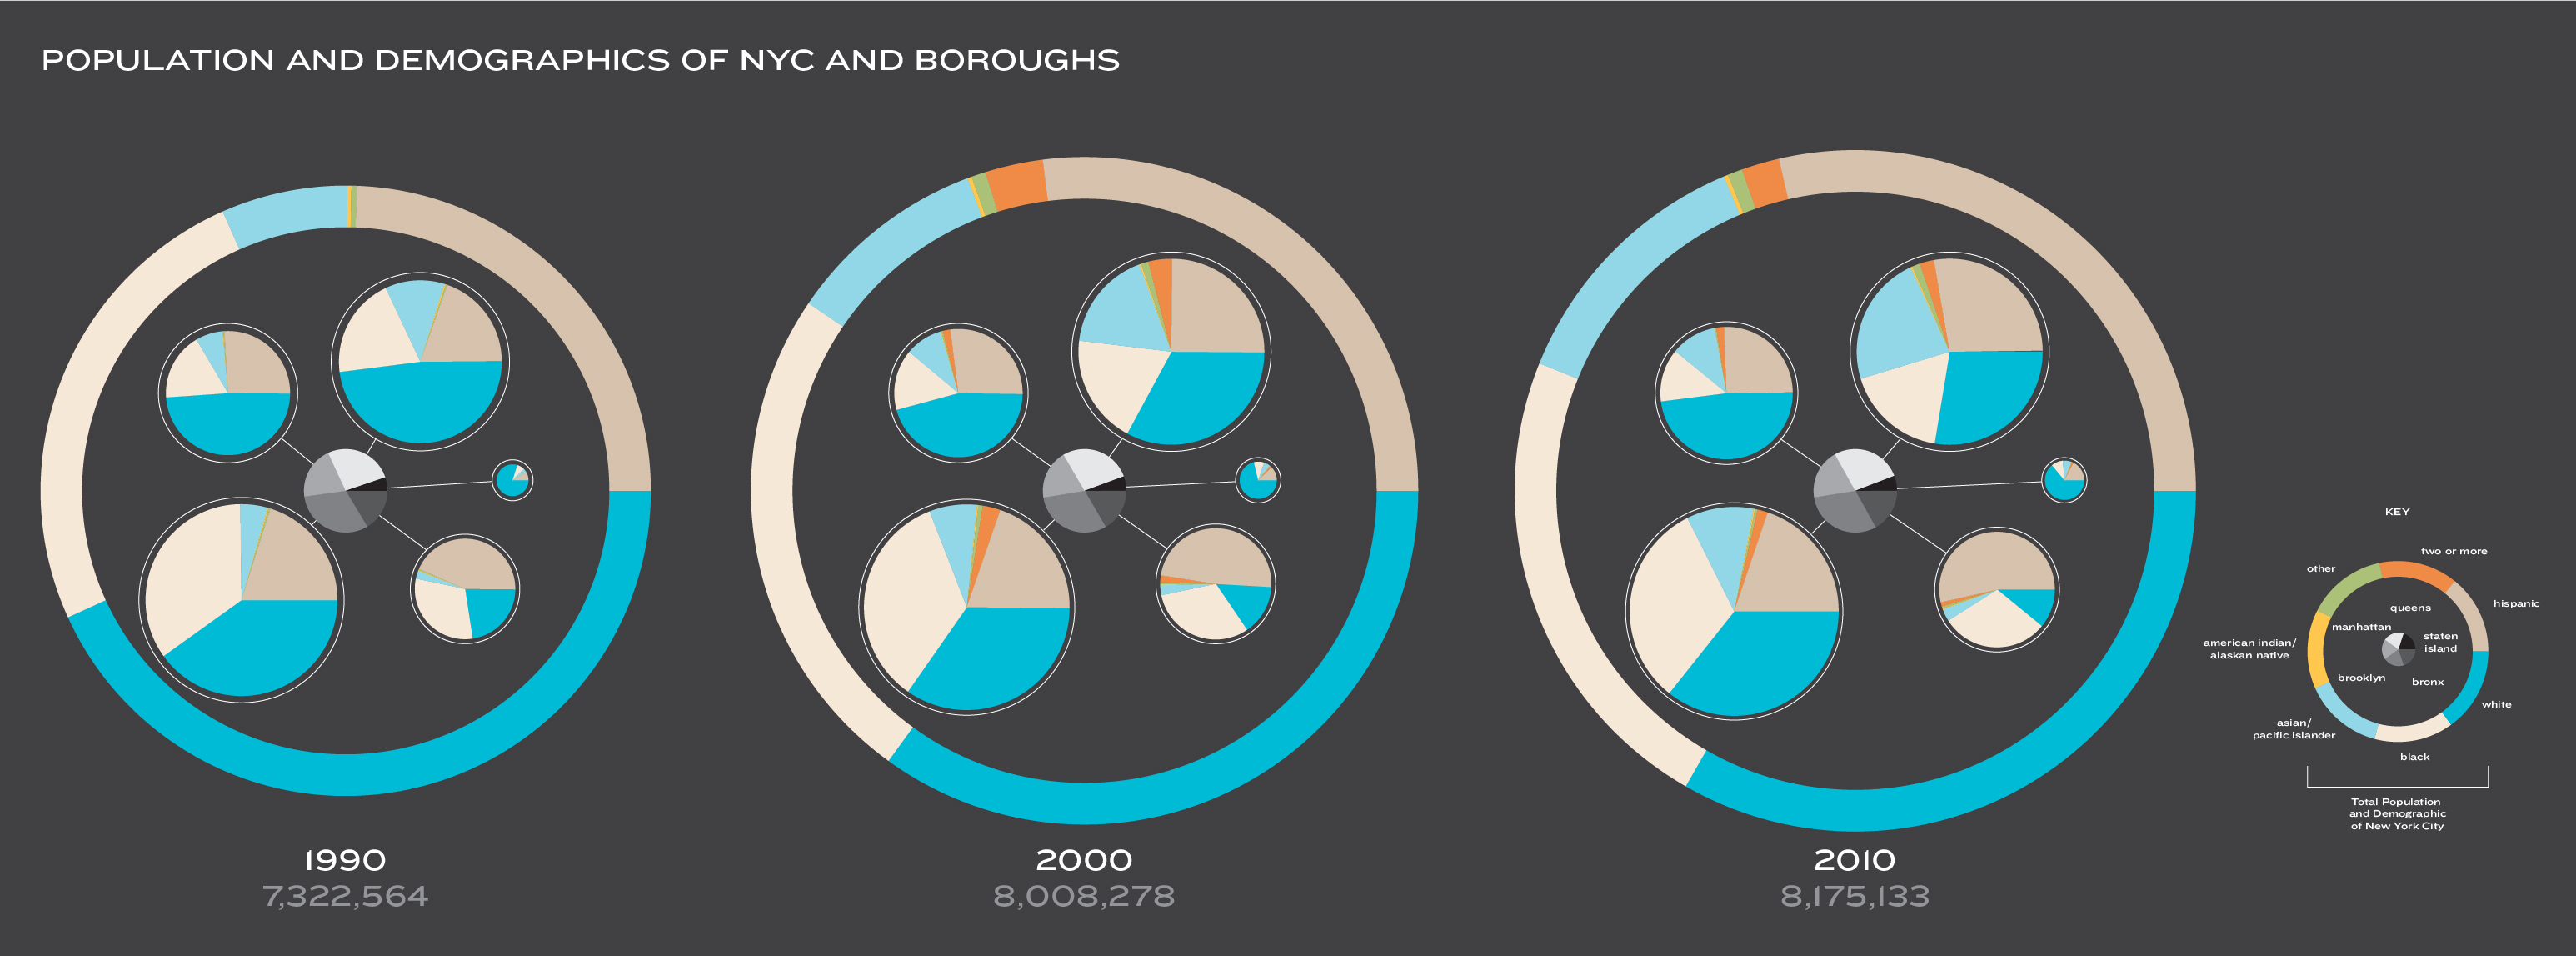
nyc_demo

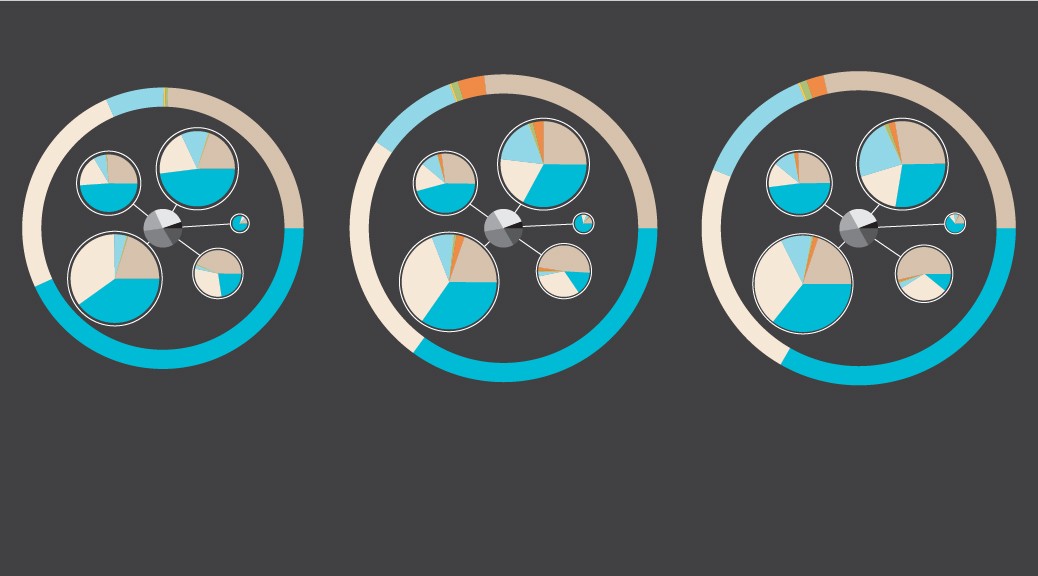
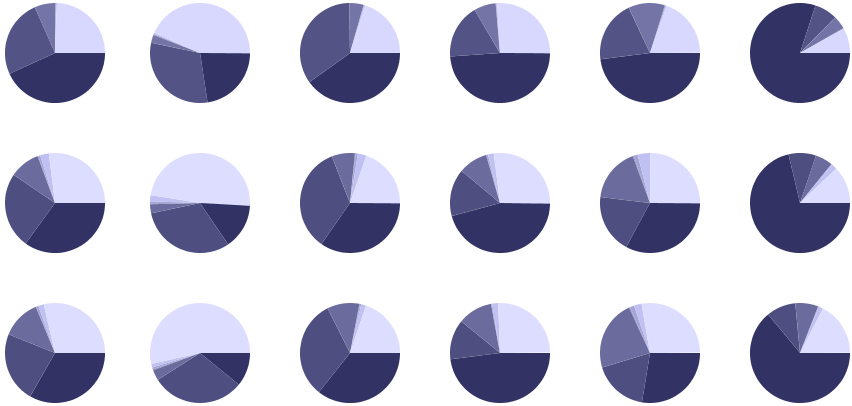
I took the information from the New York City Census. I decided to do pie charts this time (even though it might have been better as a stacked area chart) because all the other graphs have been very “straight”. I had trouble creating a function for mapping. My code contains many, many lines of me calling variables over and over again because I could not figure out how to get it so that I could just replace a variable within the mapping. Every time I created a function to replace the mapping lines, the program would tell me values needed to be determined before anything else was called. Instead, I just have a ton of lines changing each percentage to an angle.

Code: NYC Demographics

PDF


Code Warm Up

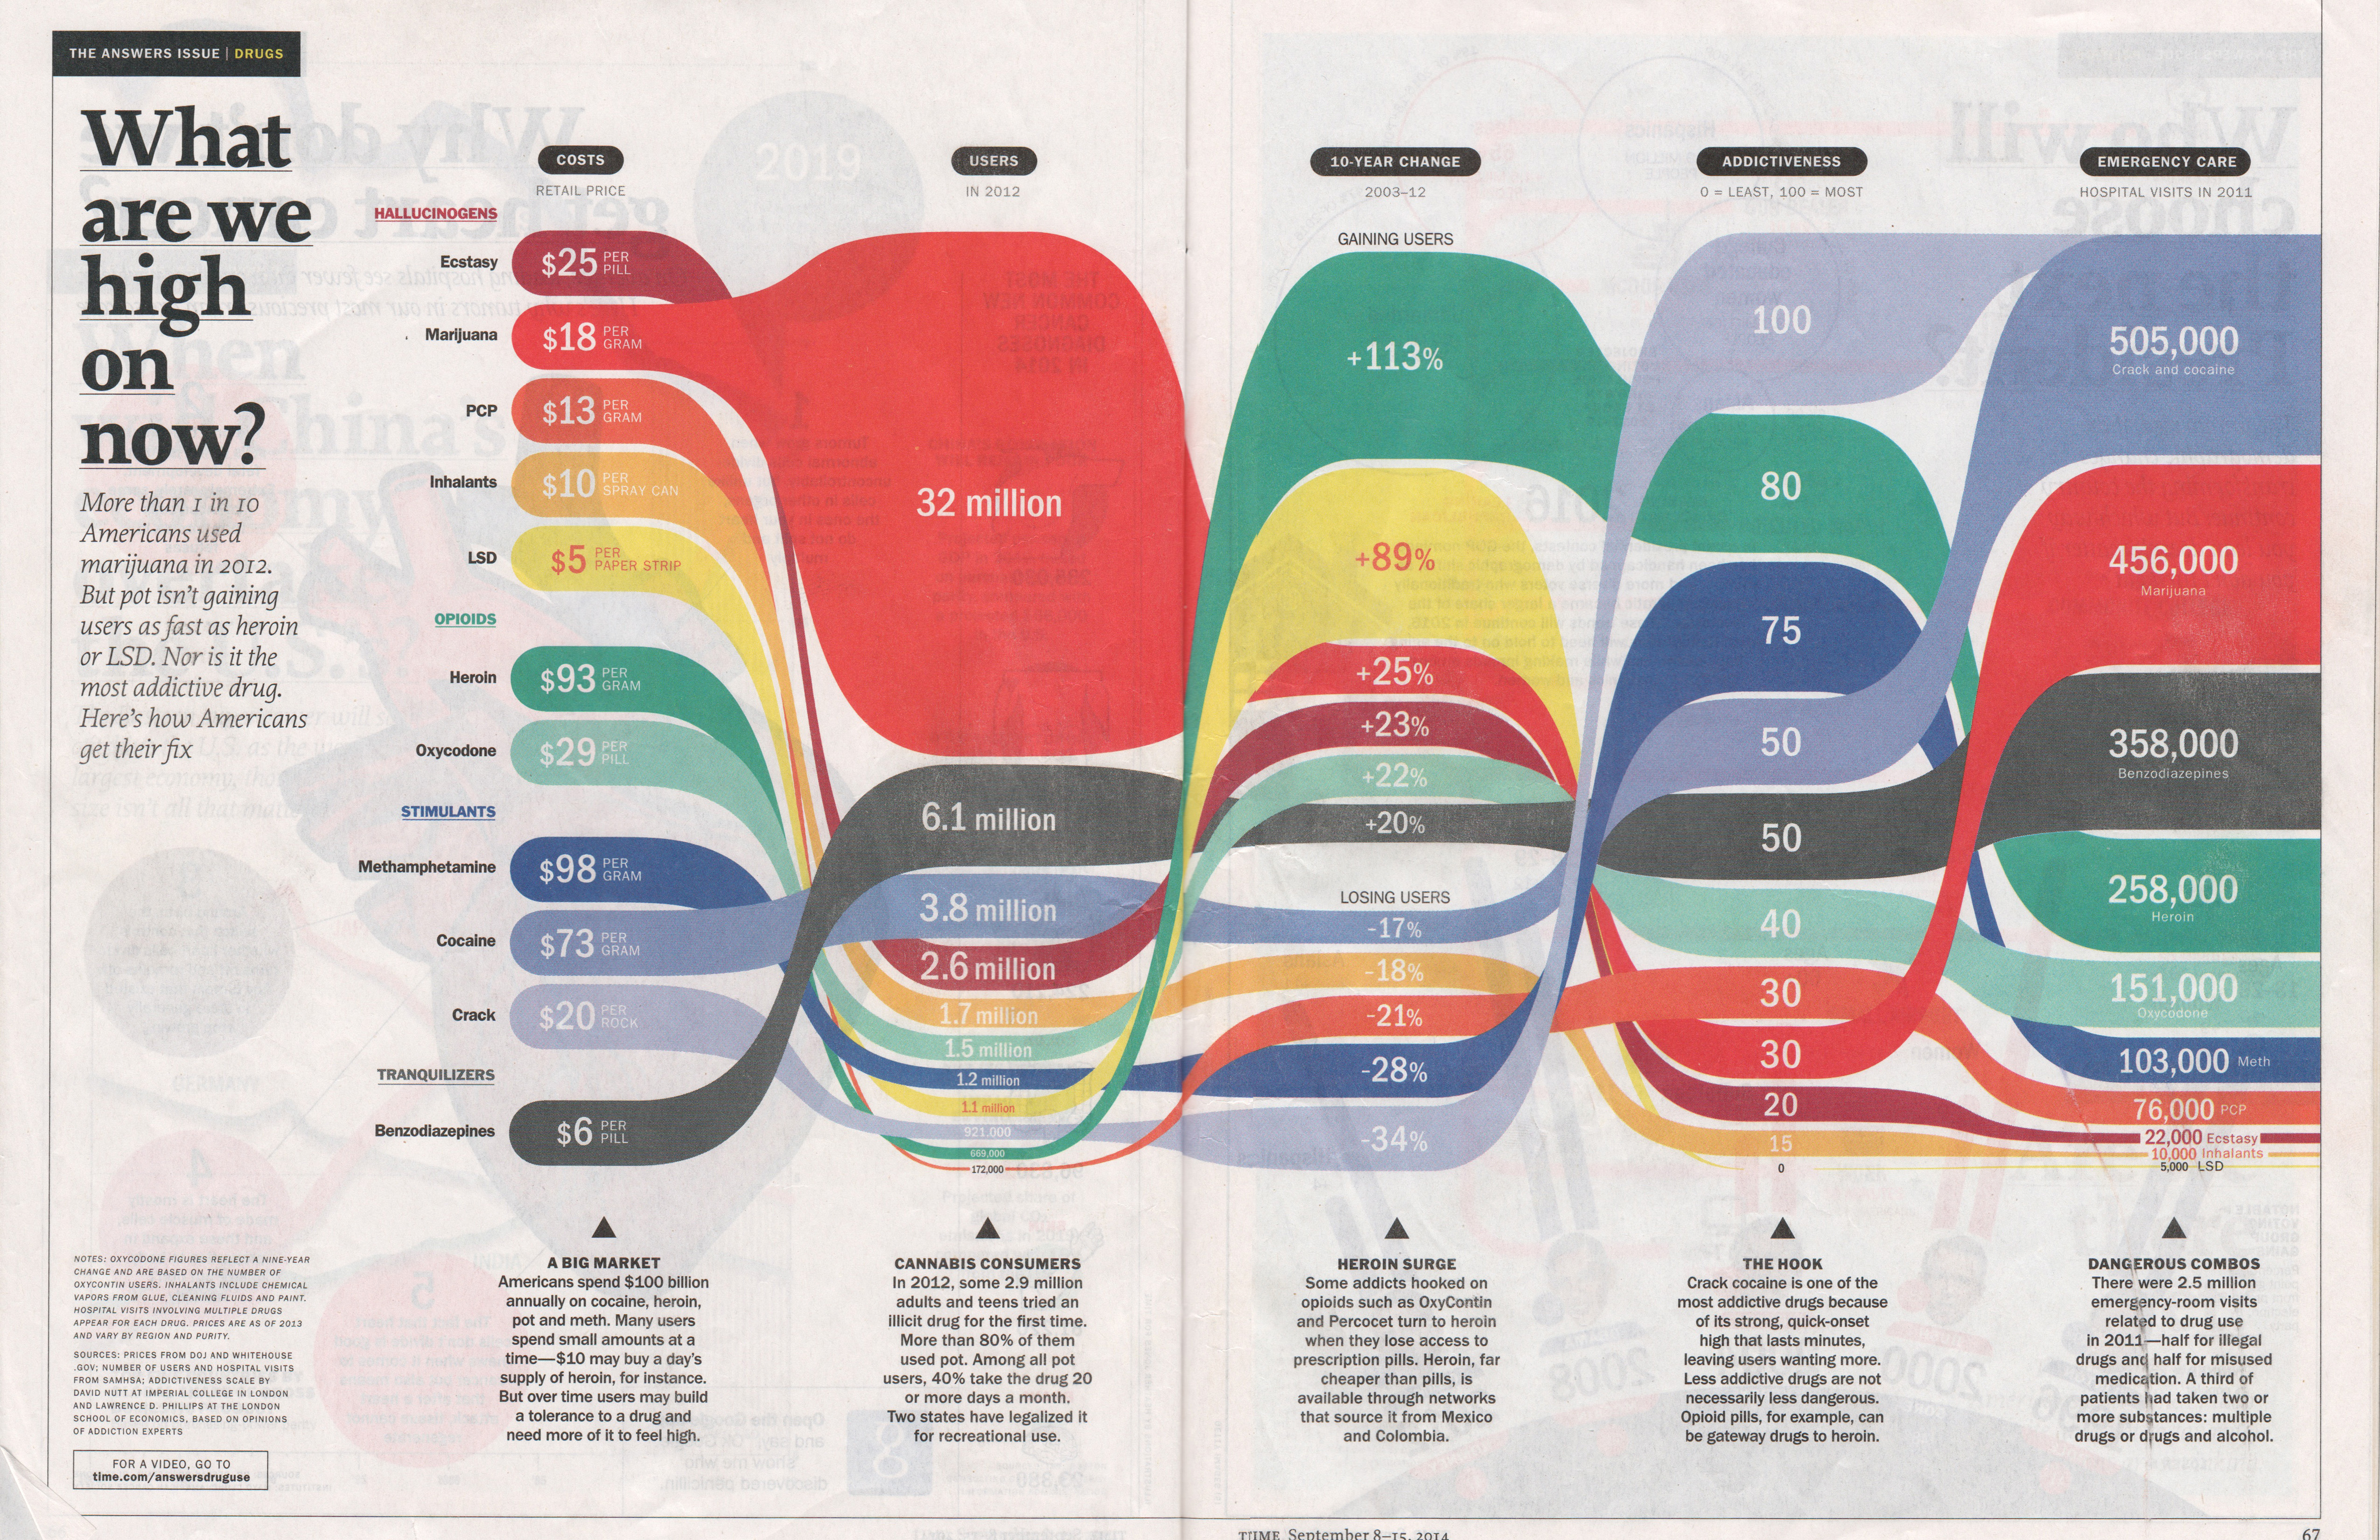
original-high

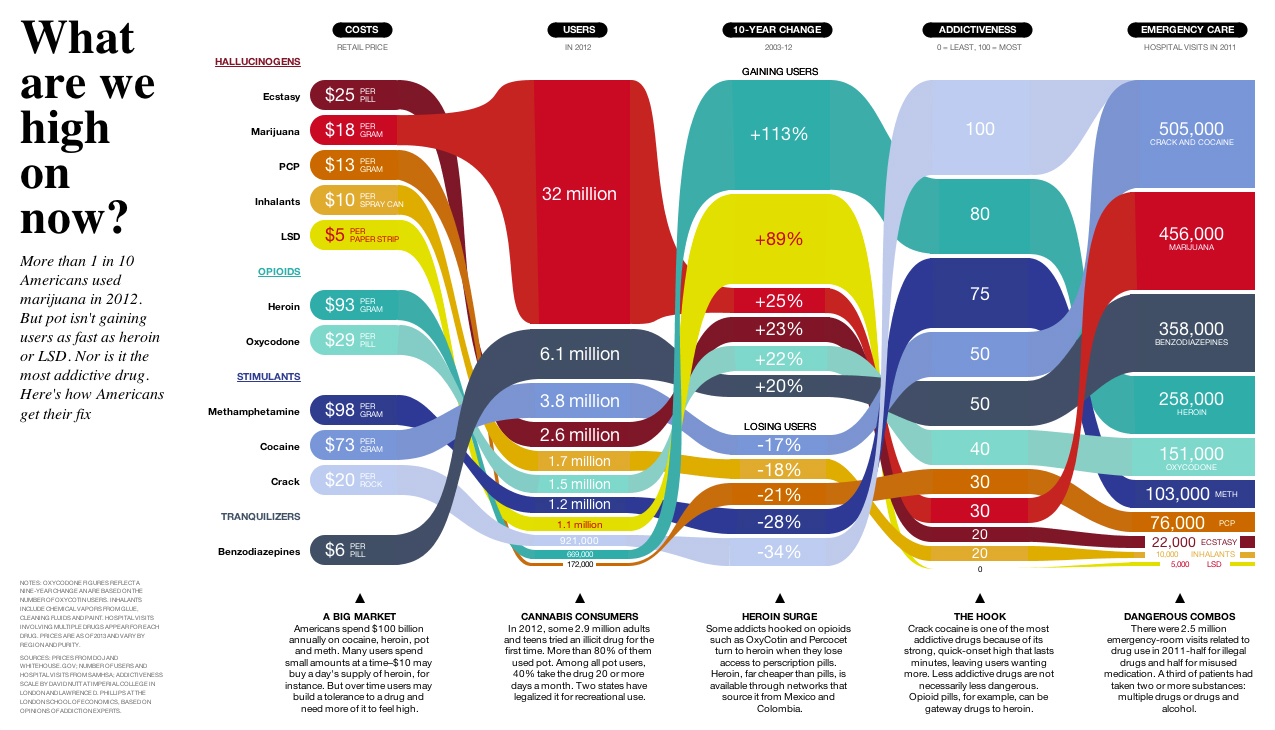
I chose to do another infographic I found in “The Answers Issue” of Time Magazine. I did was able to do everything in Processing except for the spaces between the columns when the colored bar for each drug transitions into the next column; those are svgs. It was a pain in the ass to center all the text within the shapes and was also difficult to calculate each shape with variables so that when I changed the height of one shape, it will change all of them. It was also hard to see it the colored bars were proportionate to each other. I don’t even think Time Magazine has it proportional (they do have to fit the image into the magazine).

high

Code: What are we high on now?

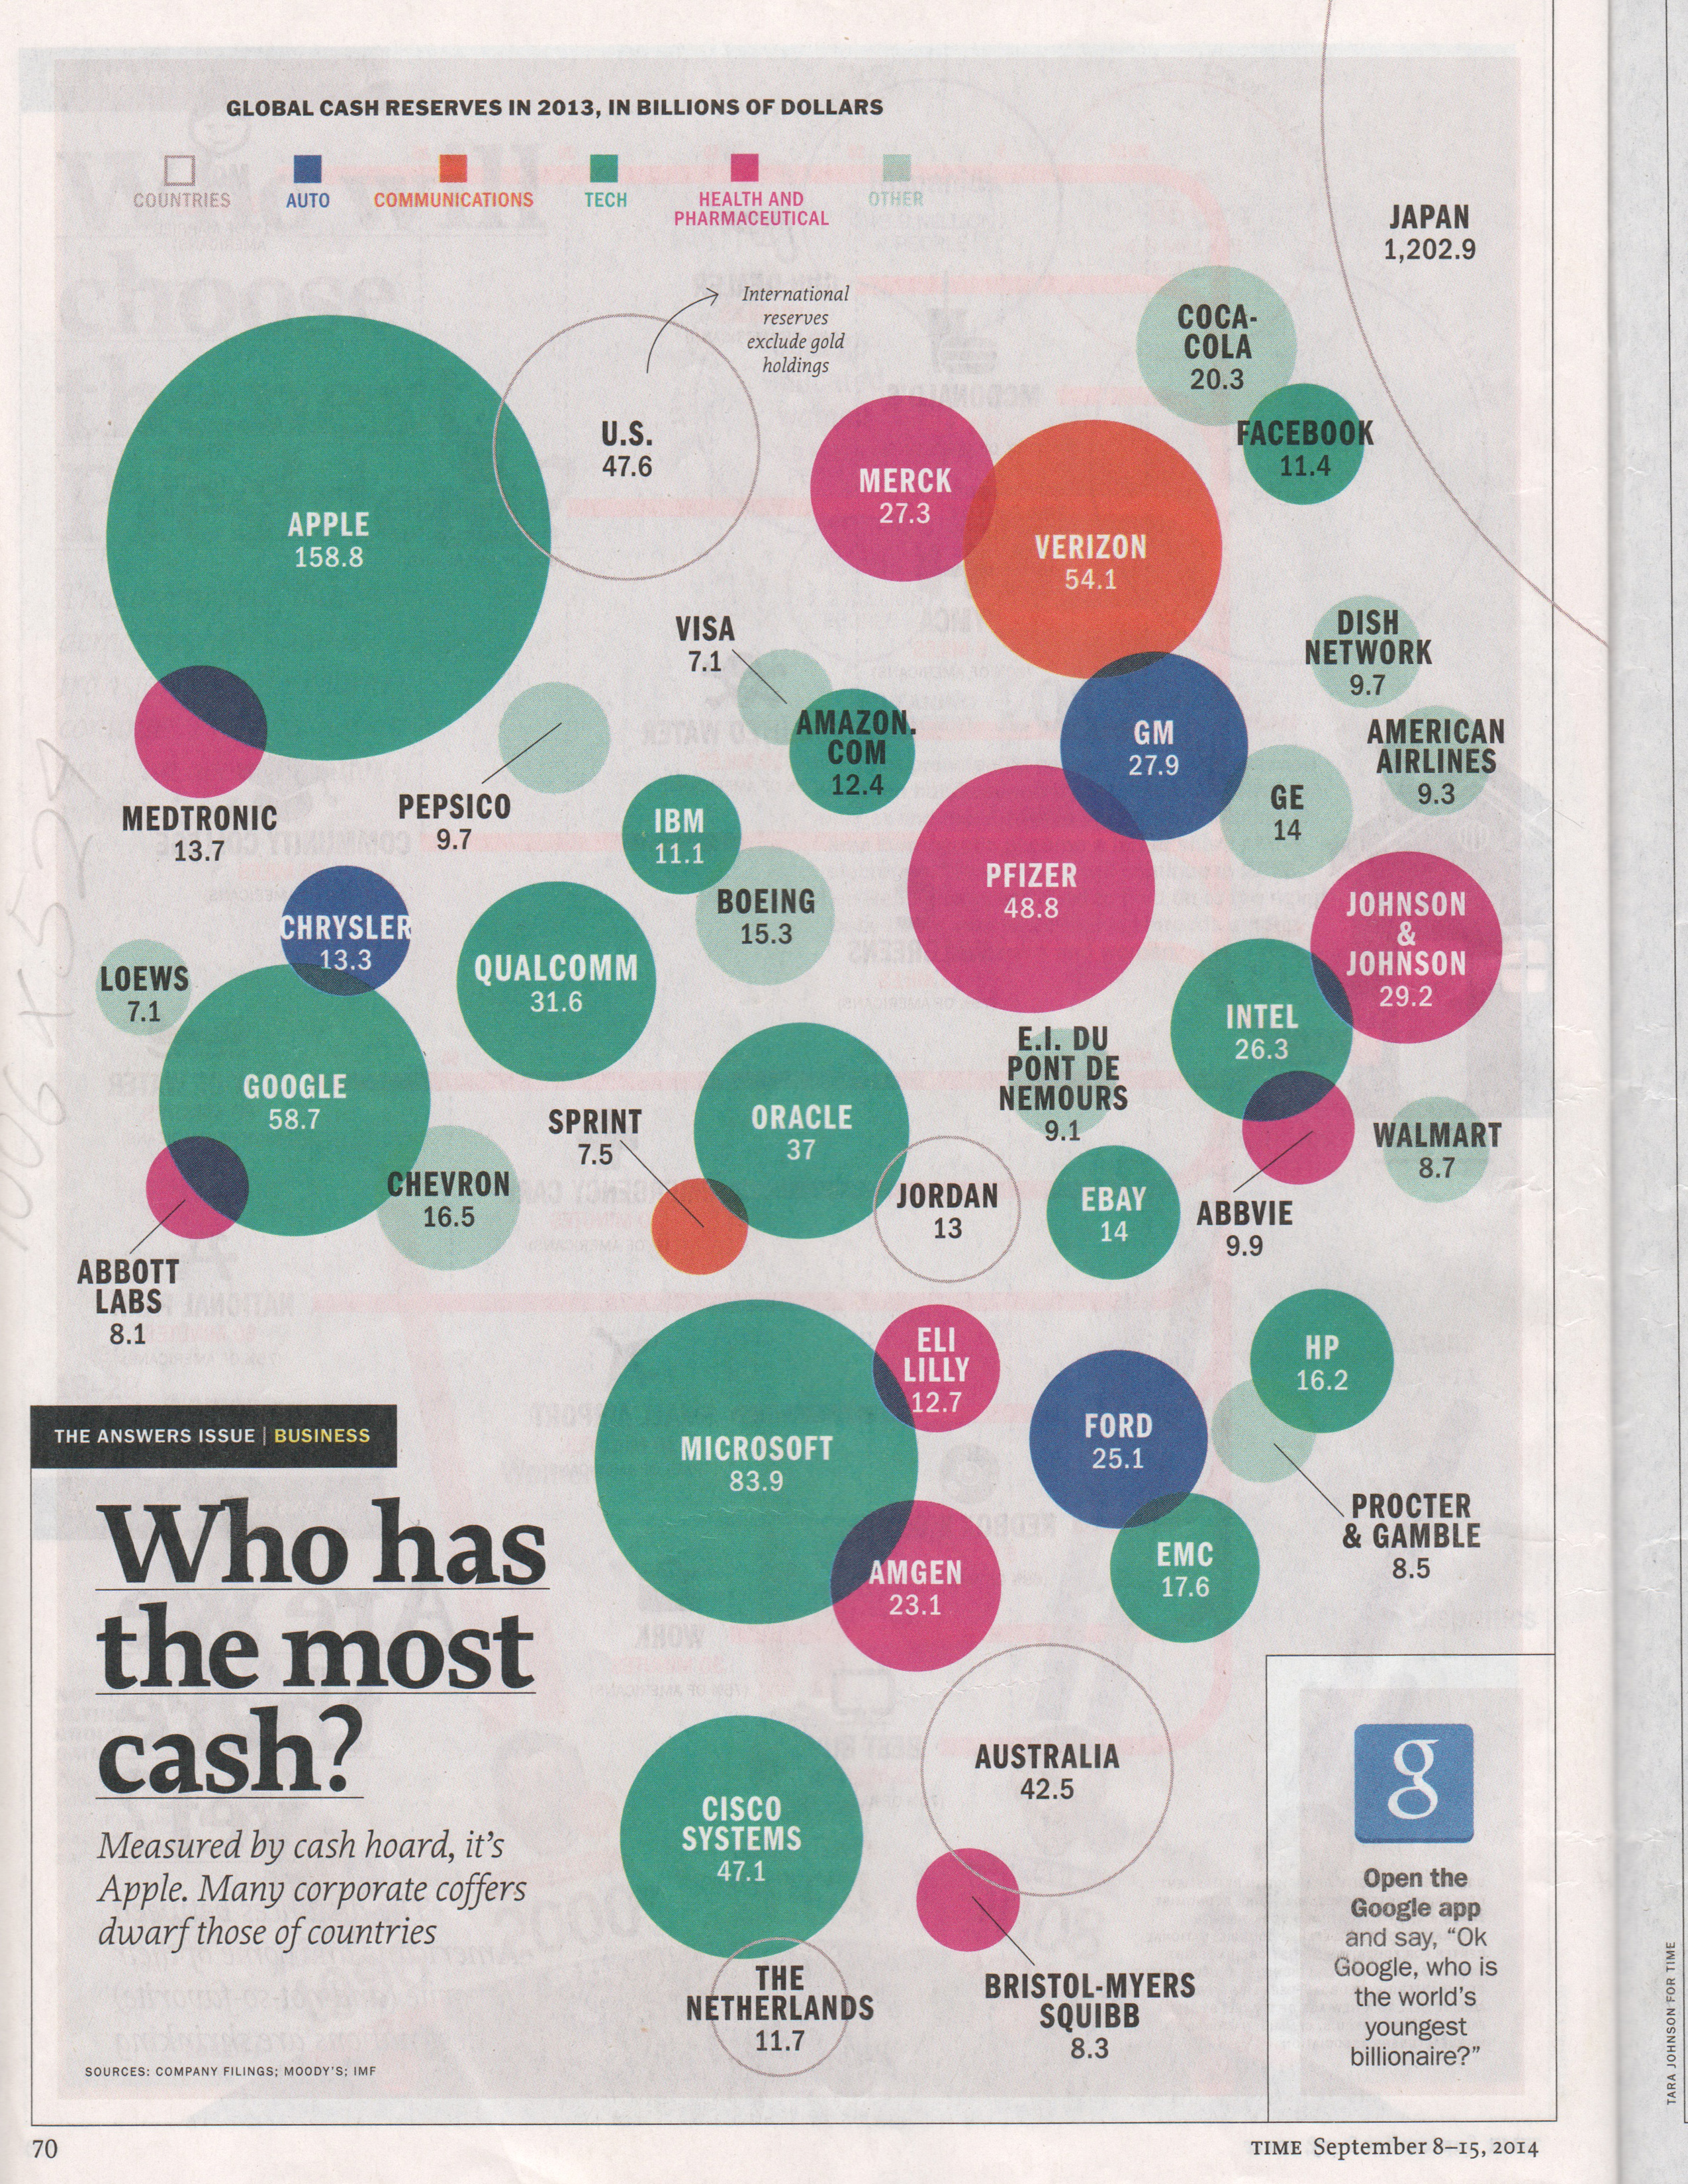
original-cash

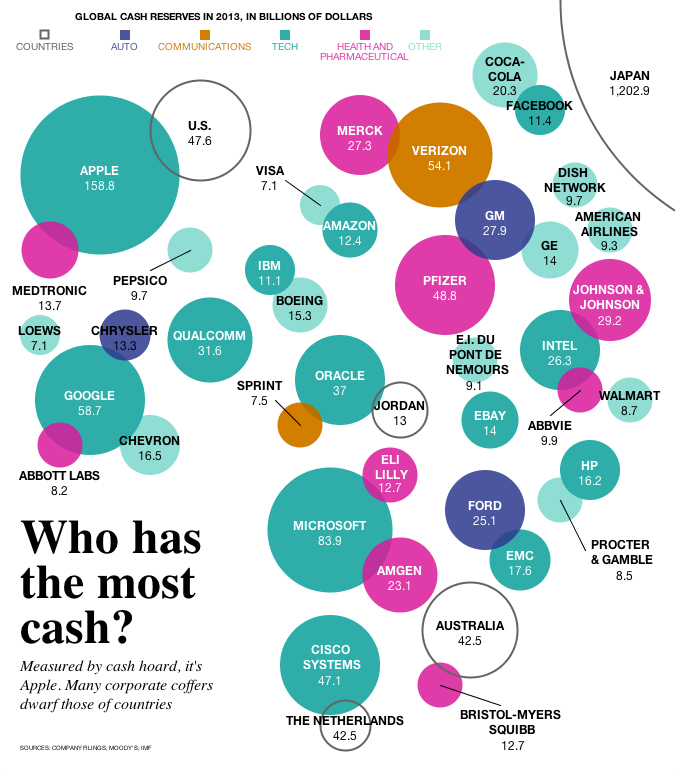
This is also from Time Magazine. It was a little hard to get the circles proportionate to each other because I was not sure of what the scale/ratio was. Positioning was also difficult; I wish there was grid on Processing. This visualization, compared to the top one, has all the shapes made in Processing (no svgs).

cash

Code: Who has the most cash?