
Pre-Illustrator
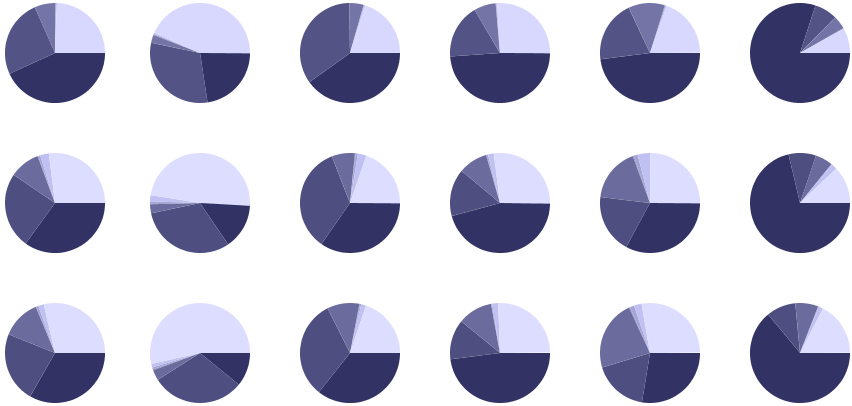
After-Illustrator
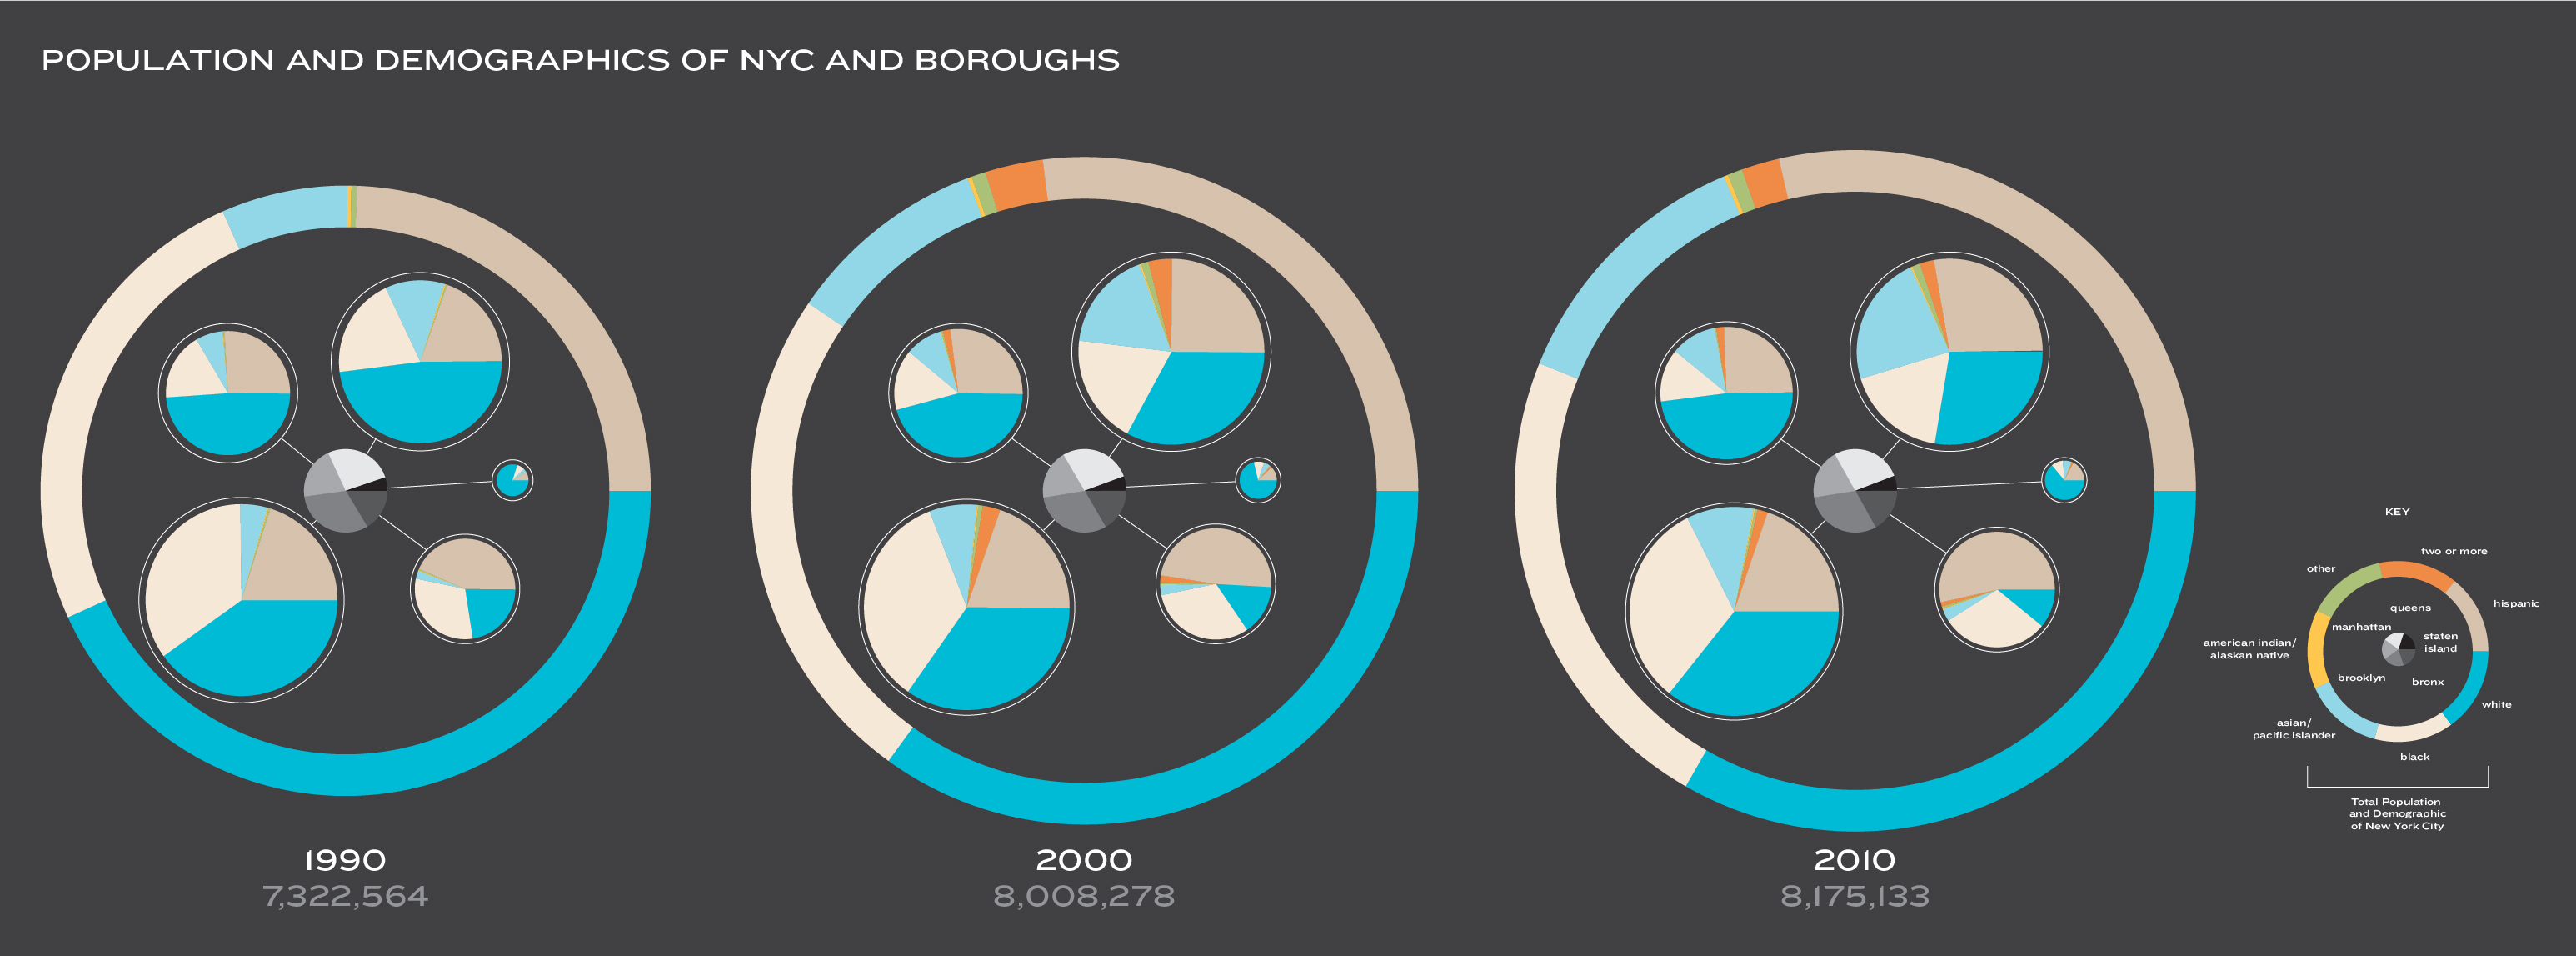
I took the information from the New York City Census. I decided to do pie charts this time (even though it might have been better as a stacked area chart) because all the other graphs have been very “straight”. I had trouble creating a function for mapping. My code contains many, many lines of me calling variables over and over again because I could not figure out how to get it so that I could just replace a variable within the mapping. Every time I created a function to replace the mapping lines, the program would tell me values needed to be determined before anything else was called. Instead, I just have a ton of lines changing each percentage to an angle.
Code: NYC Demographics